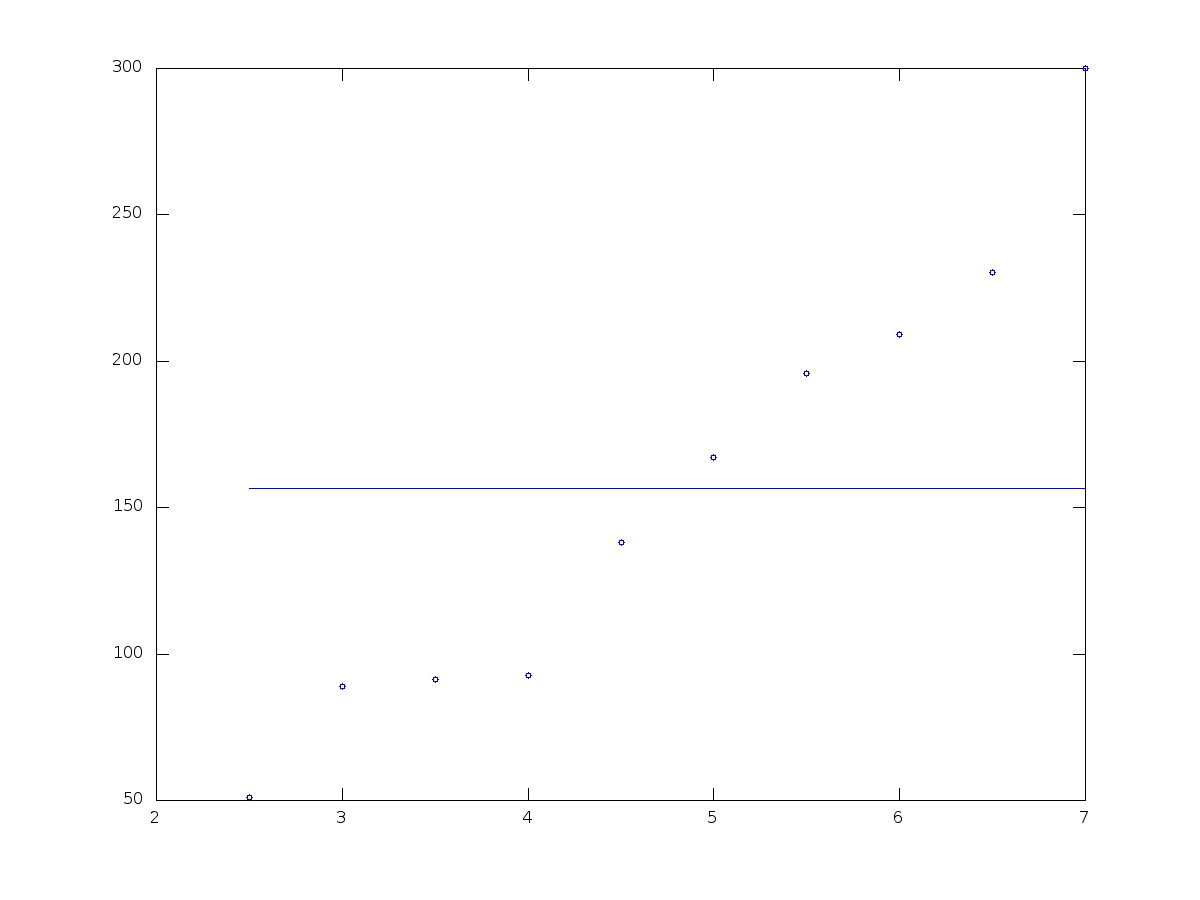
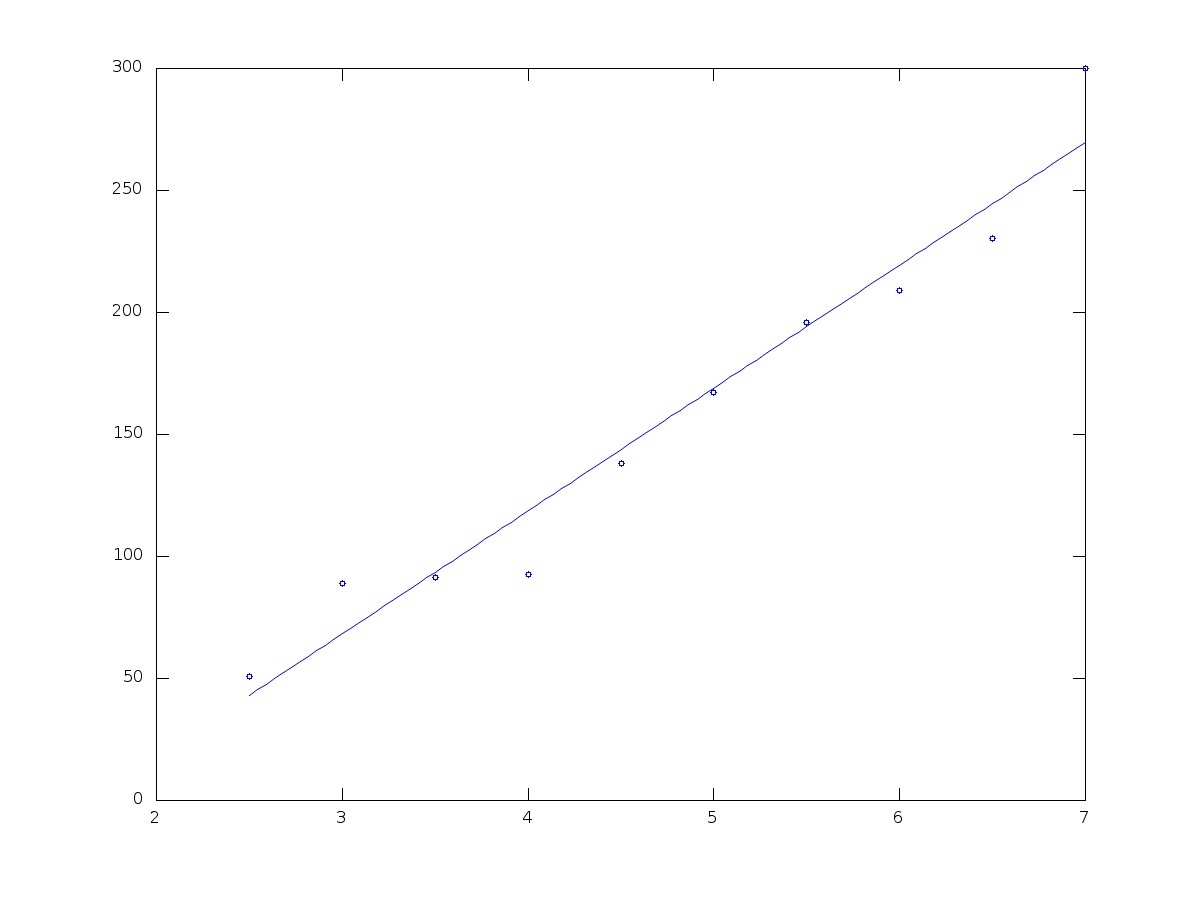
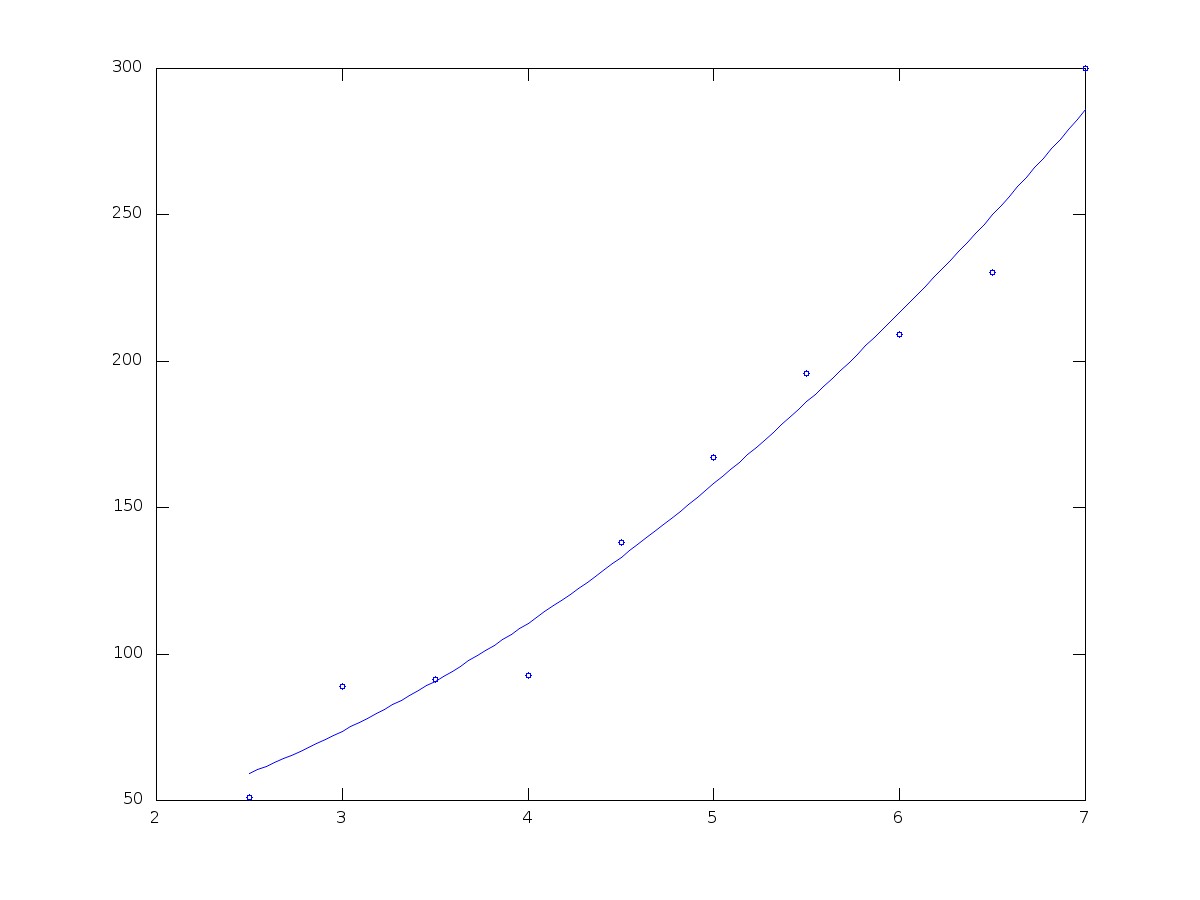
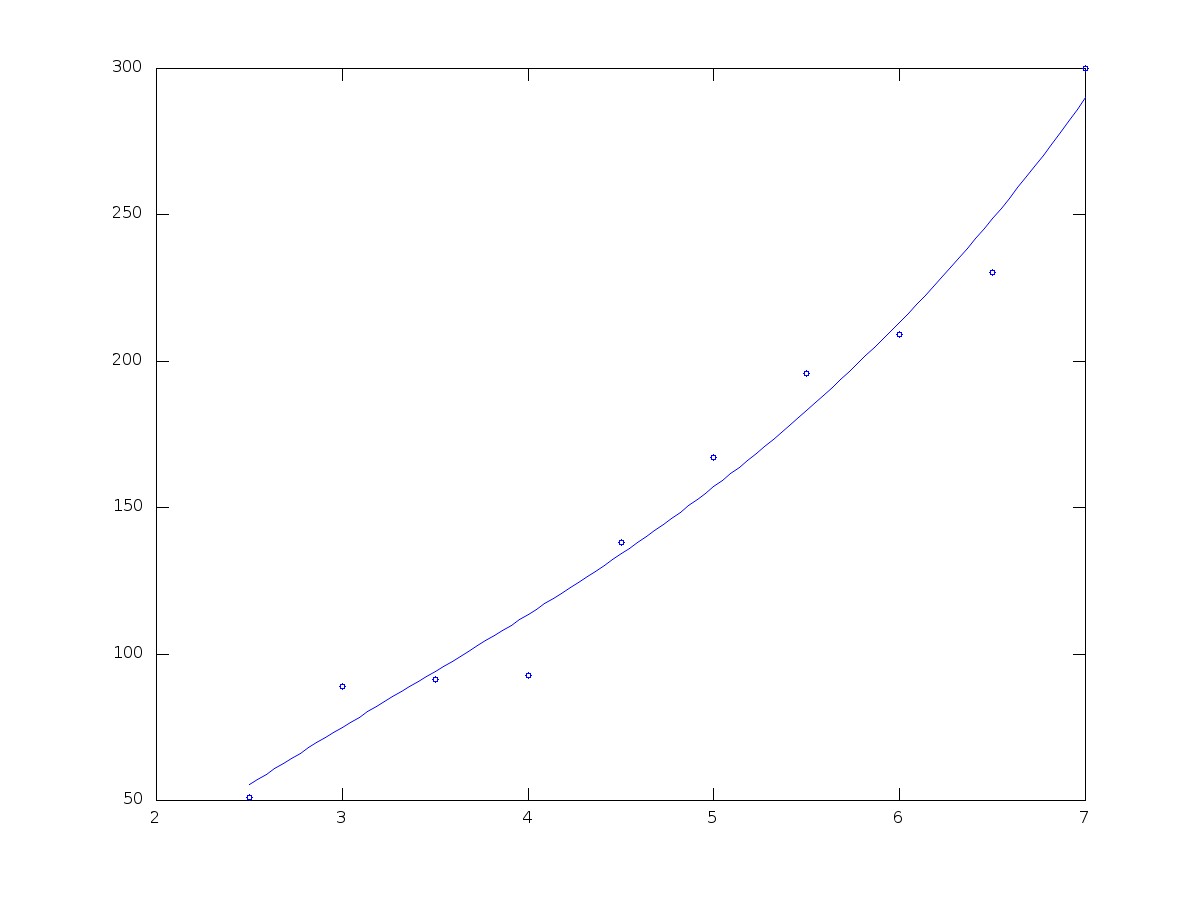
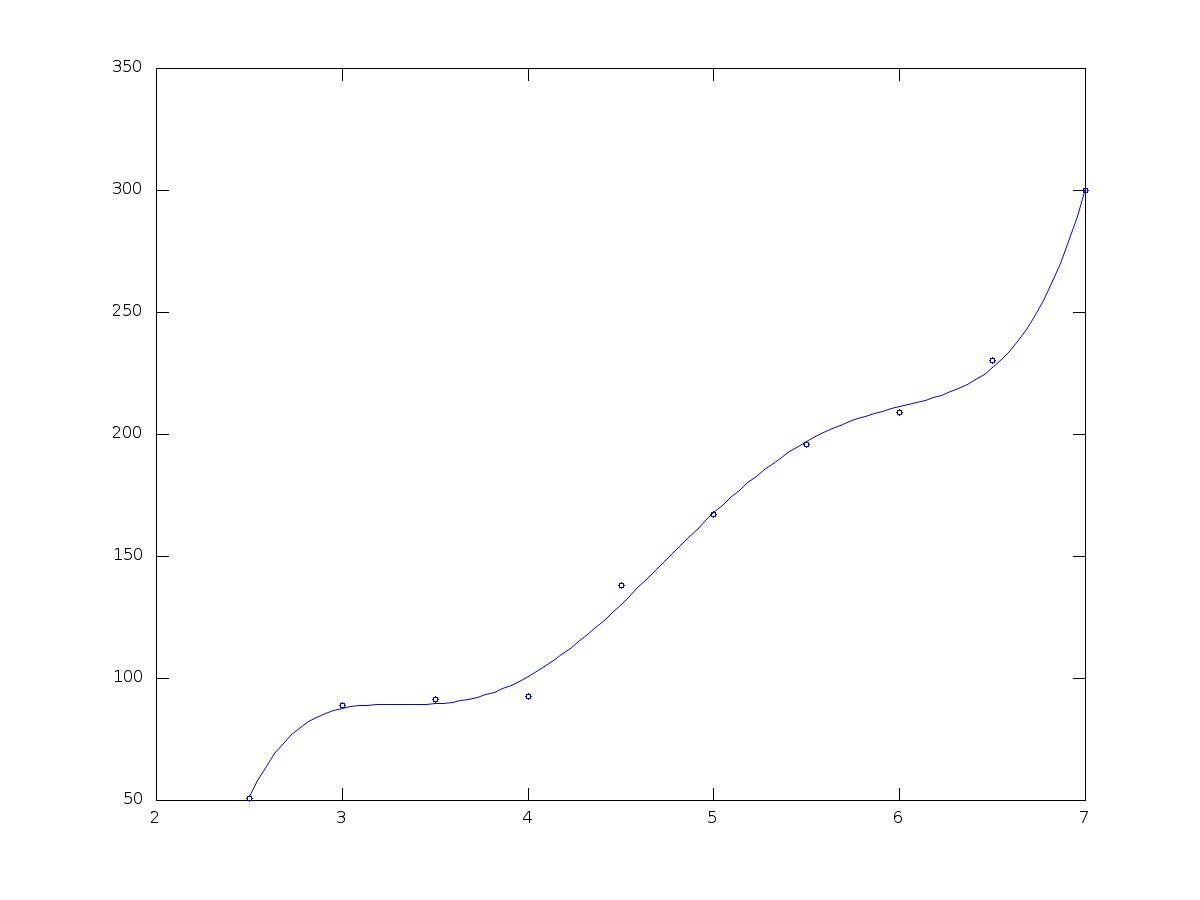
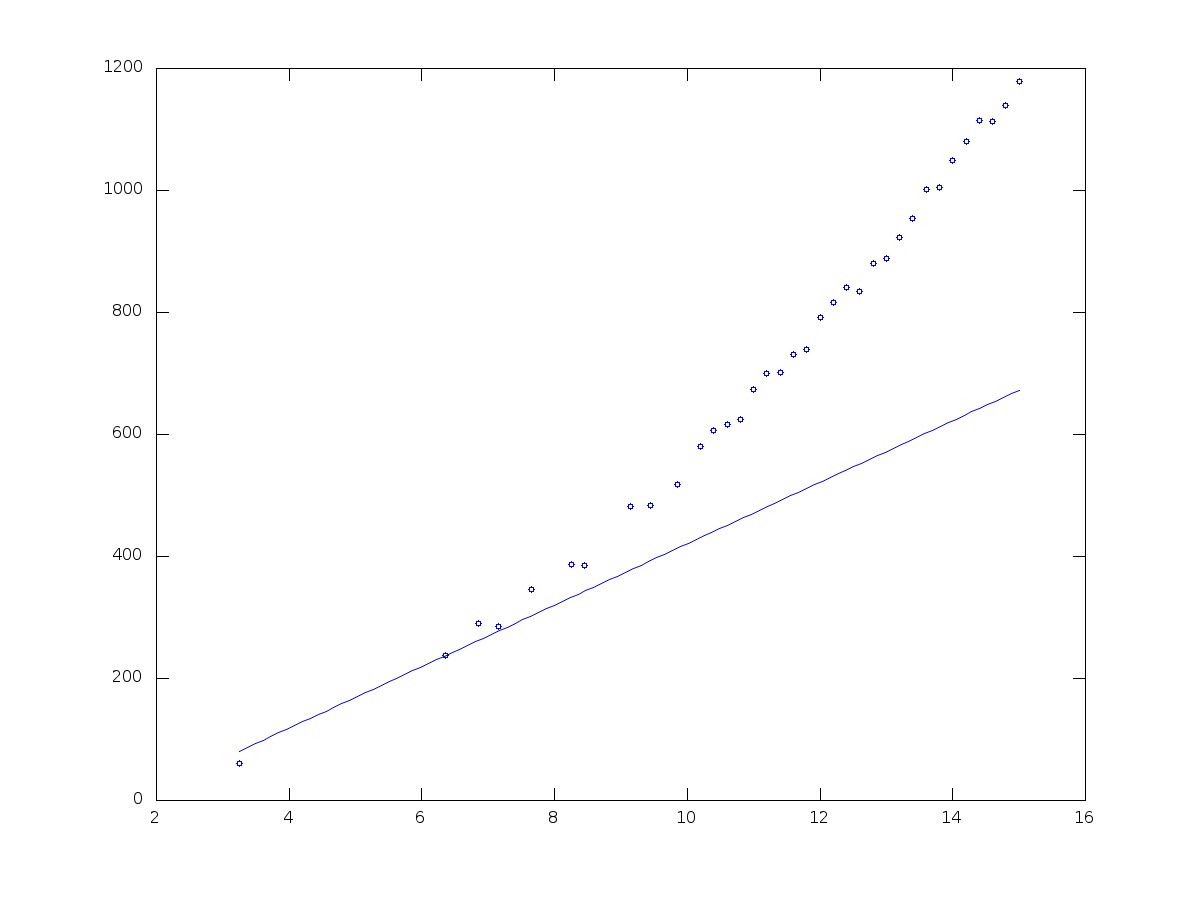
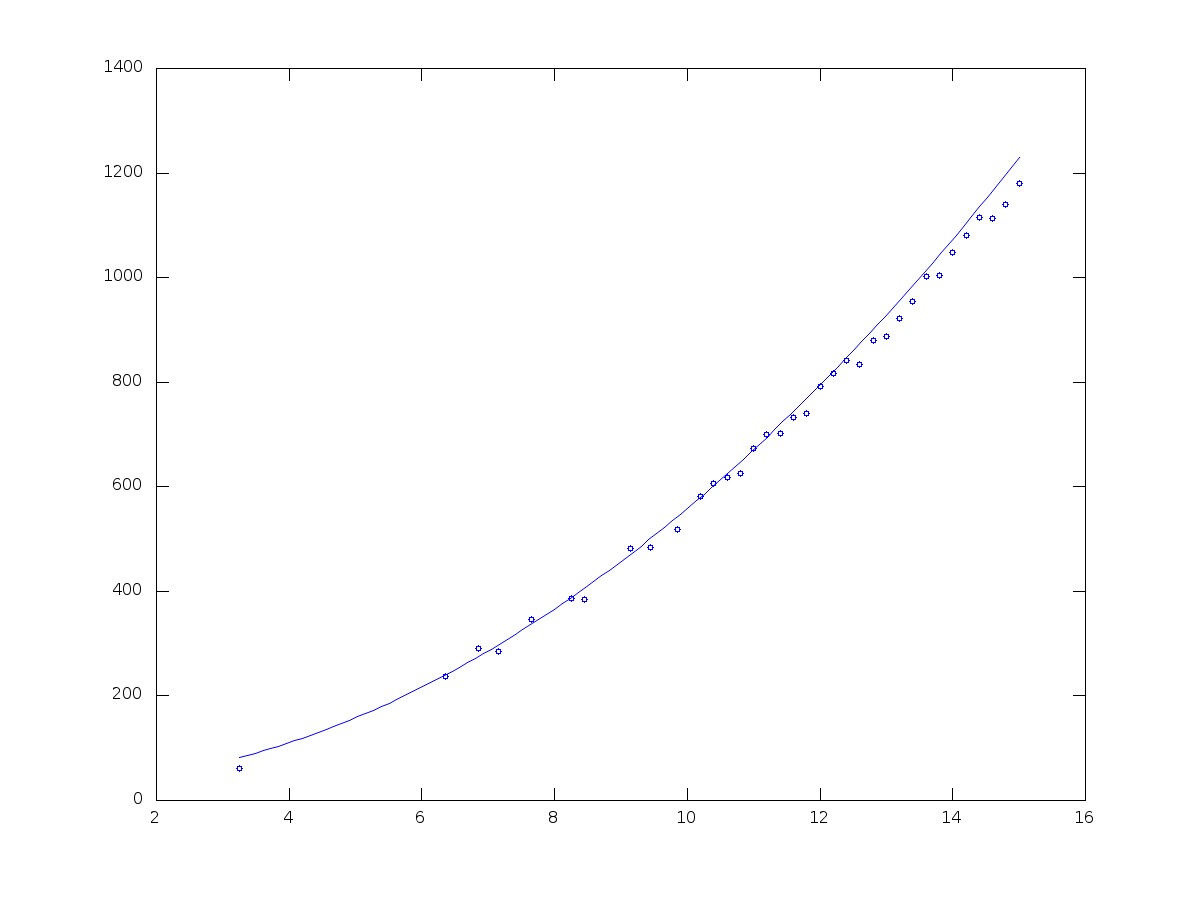
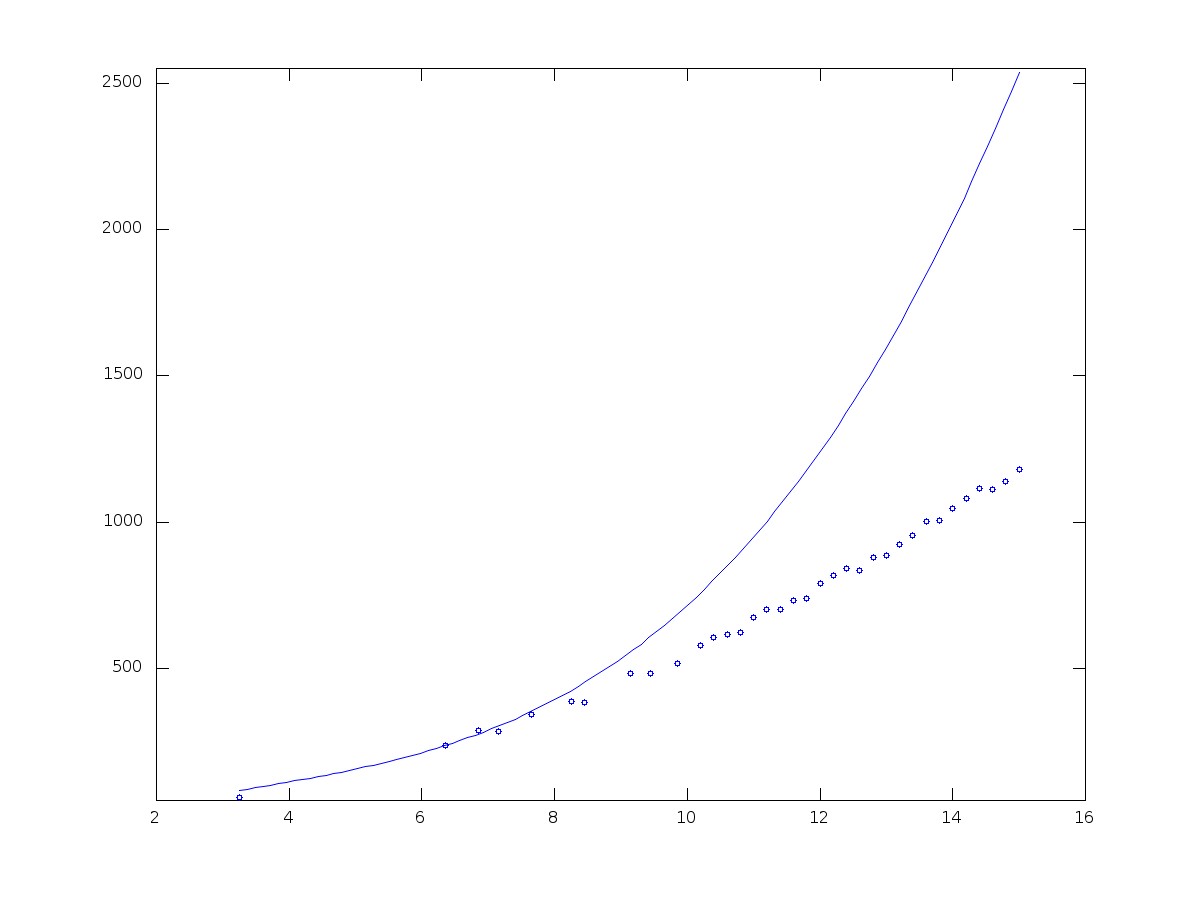
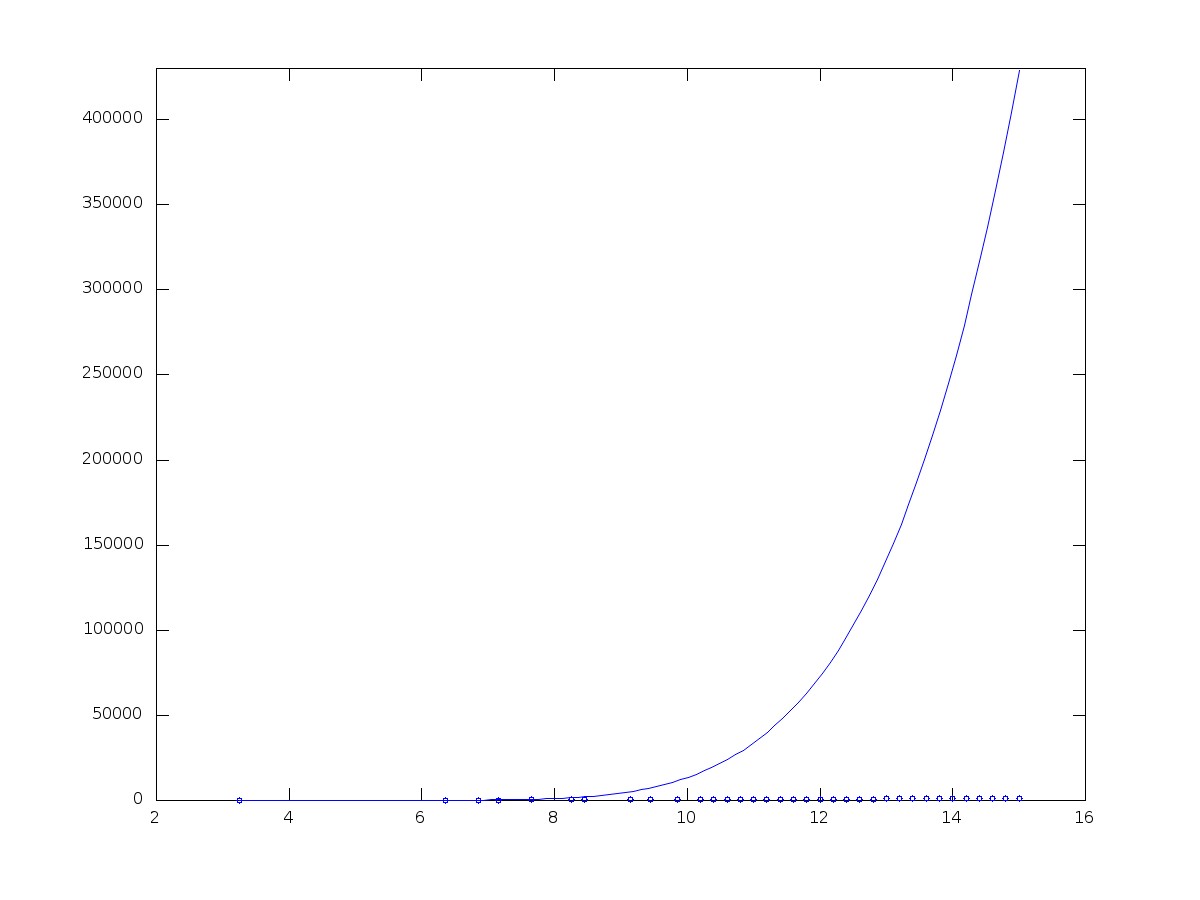
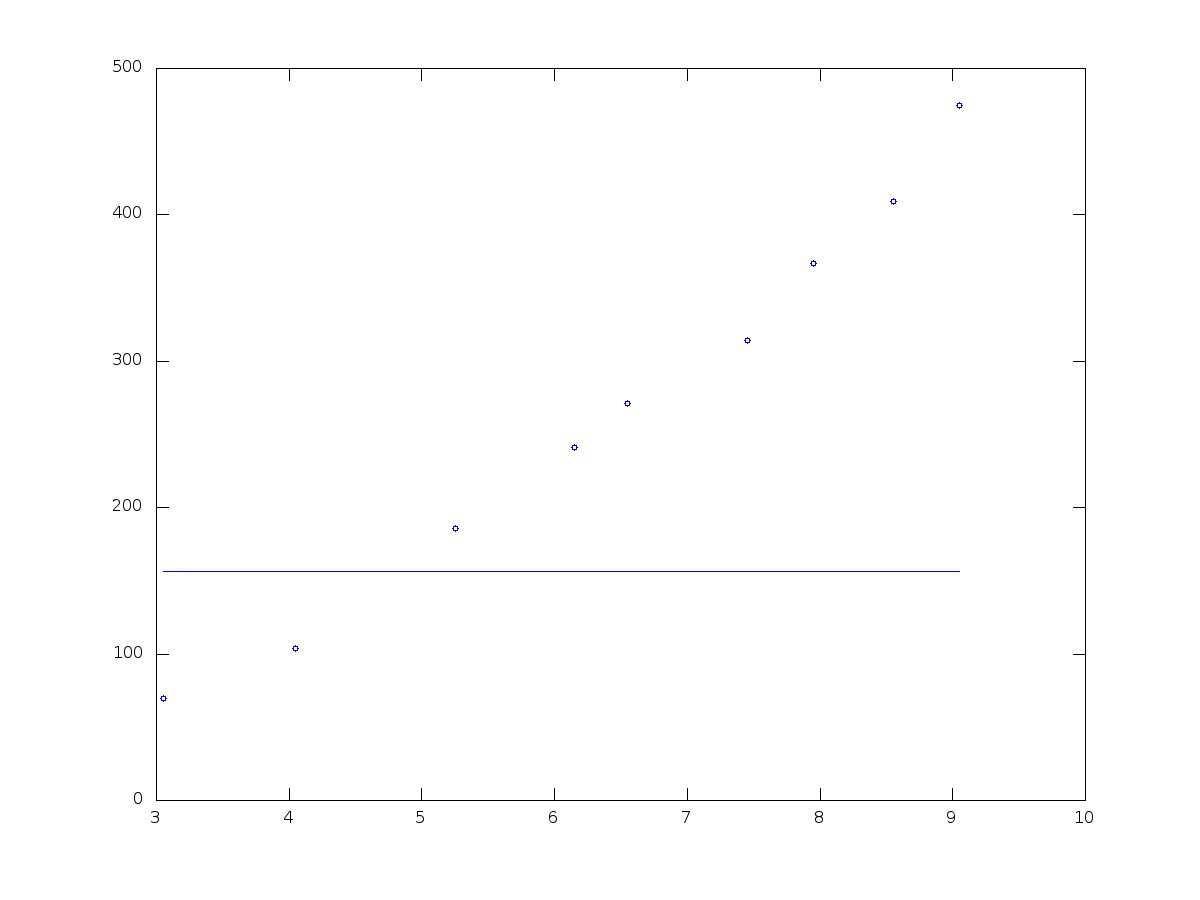
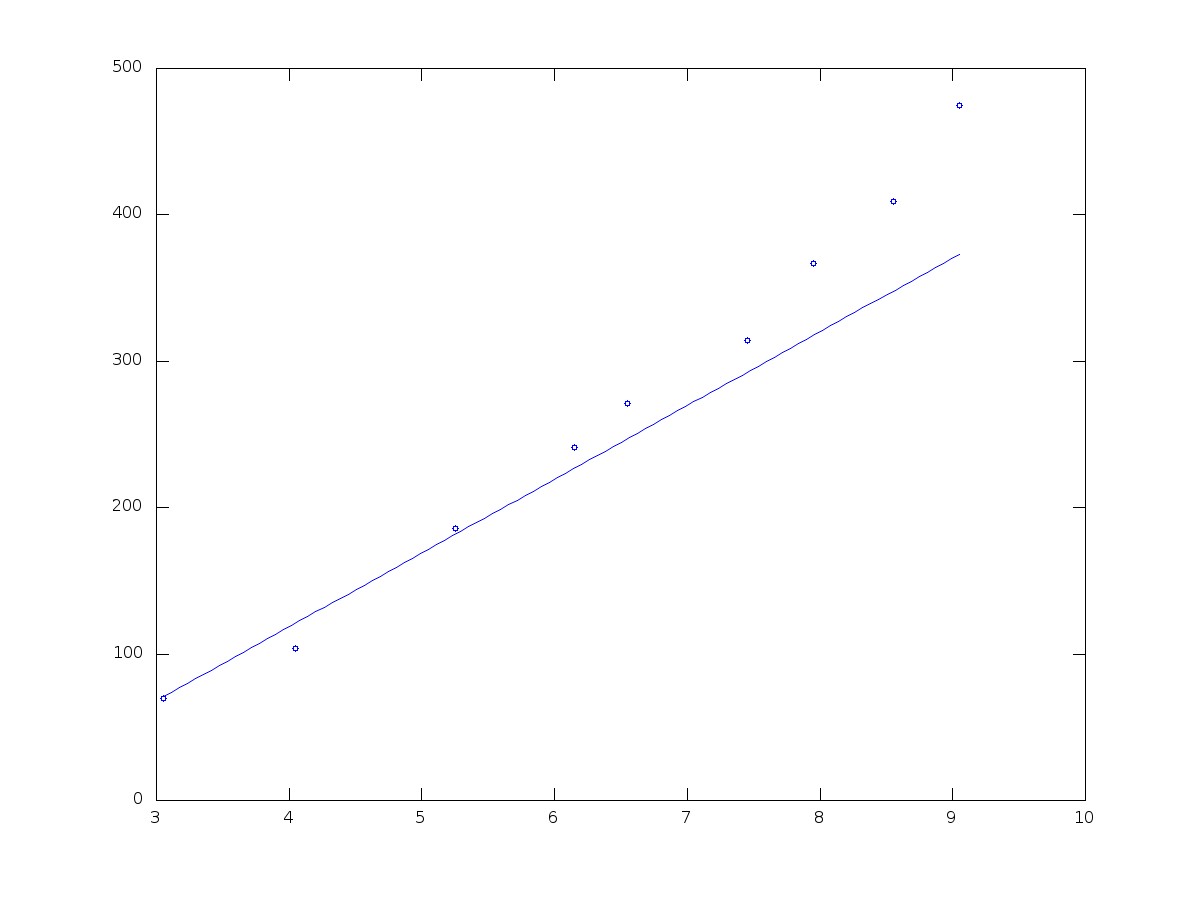
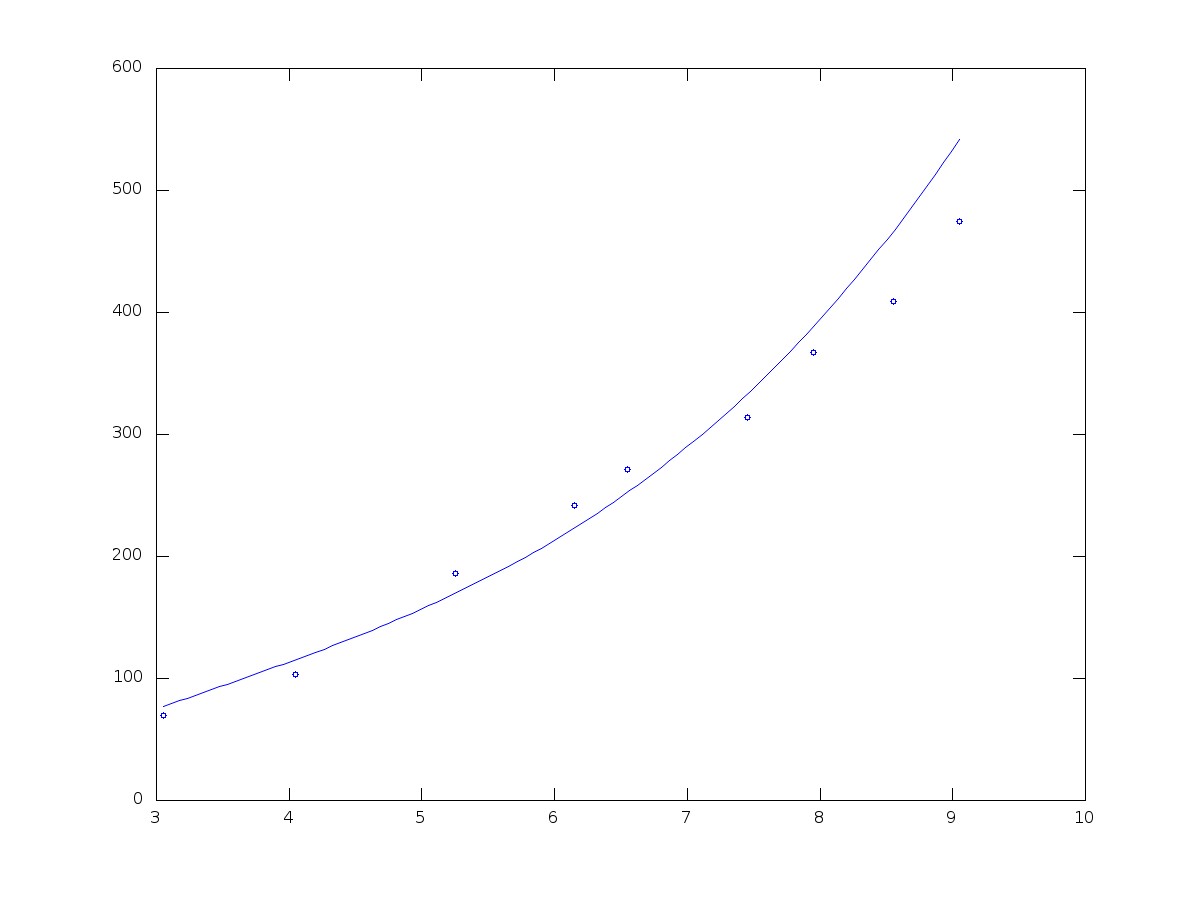
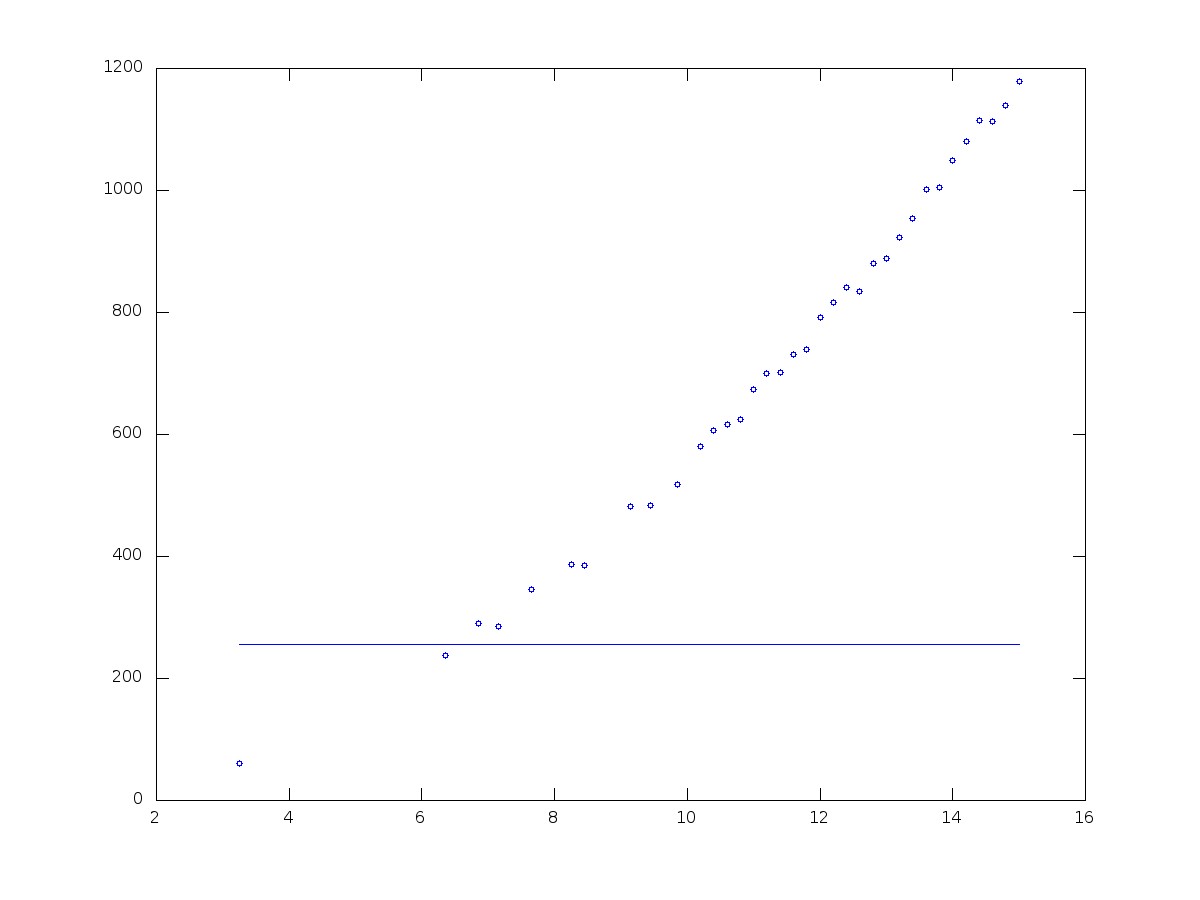
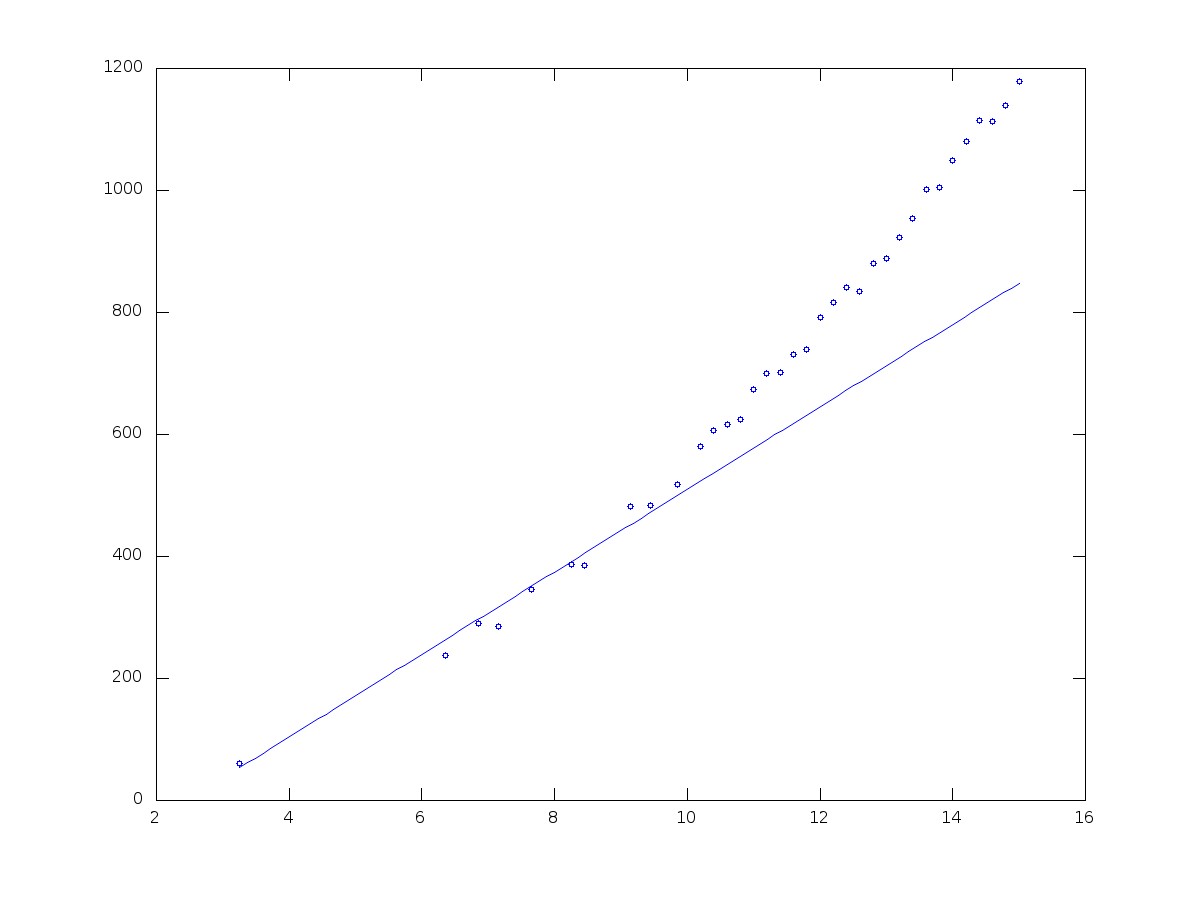
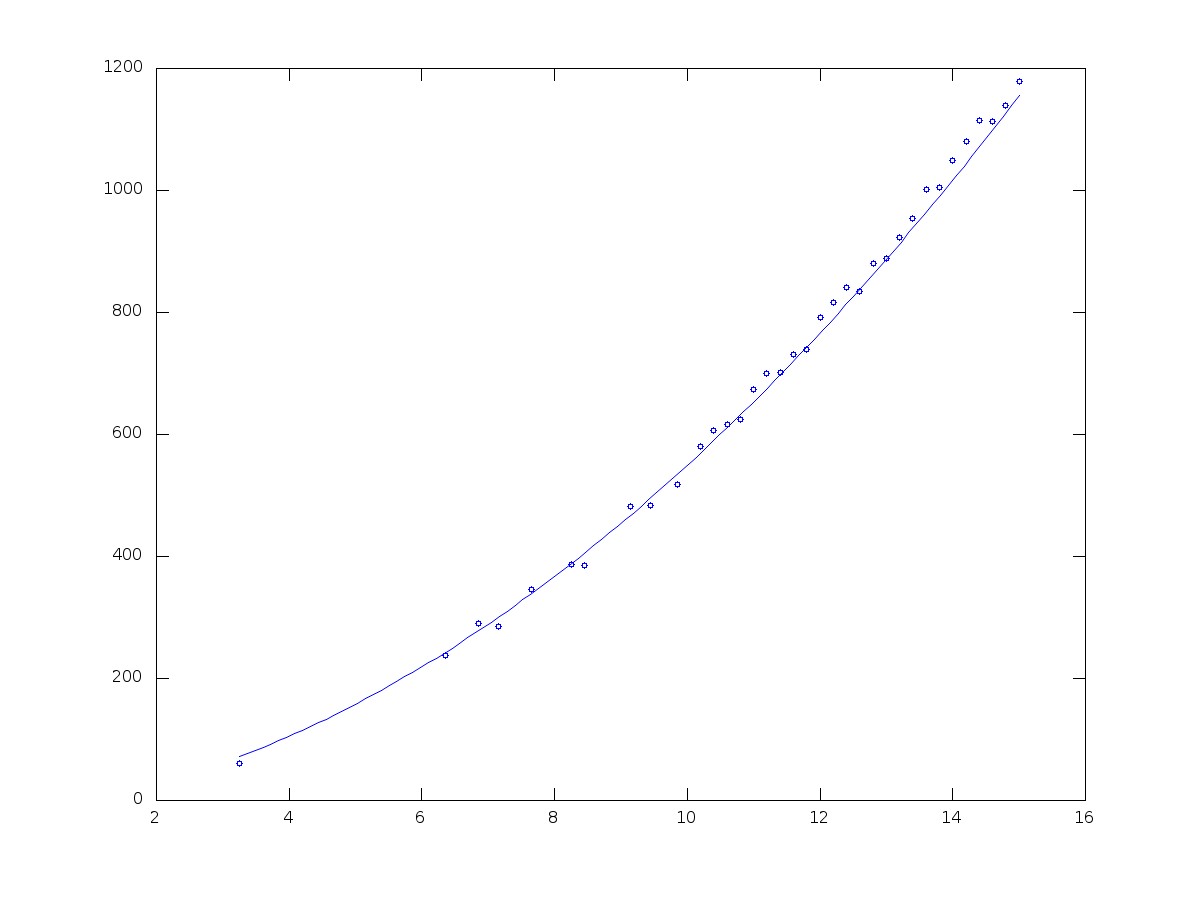
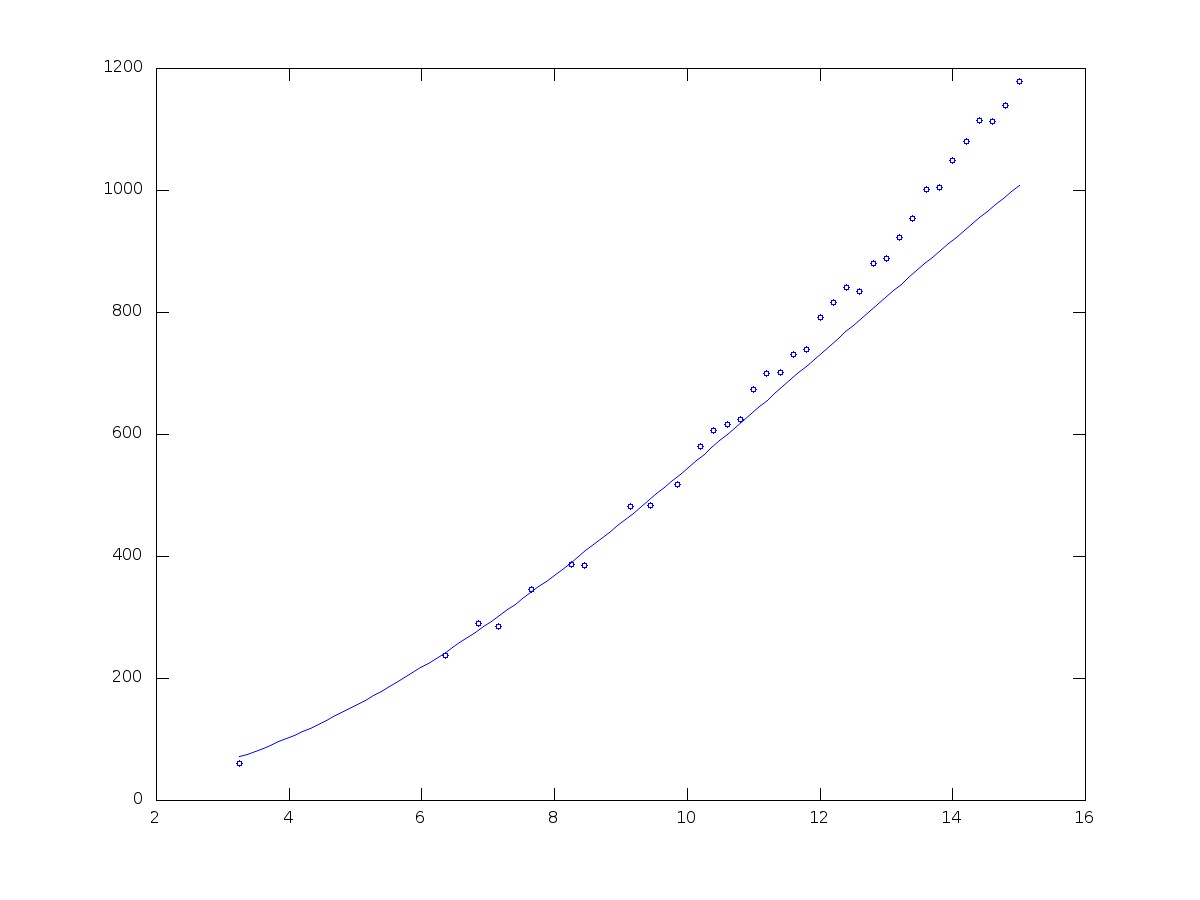
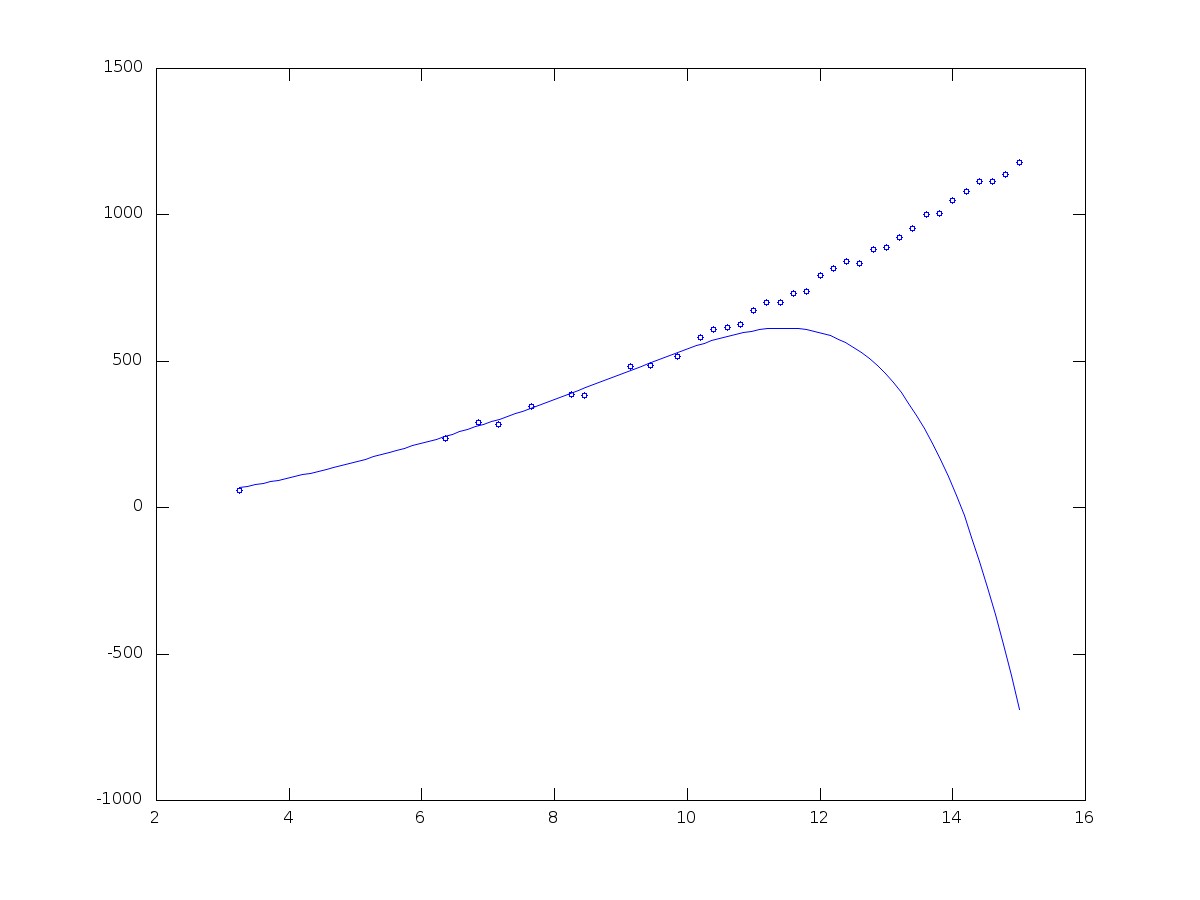
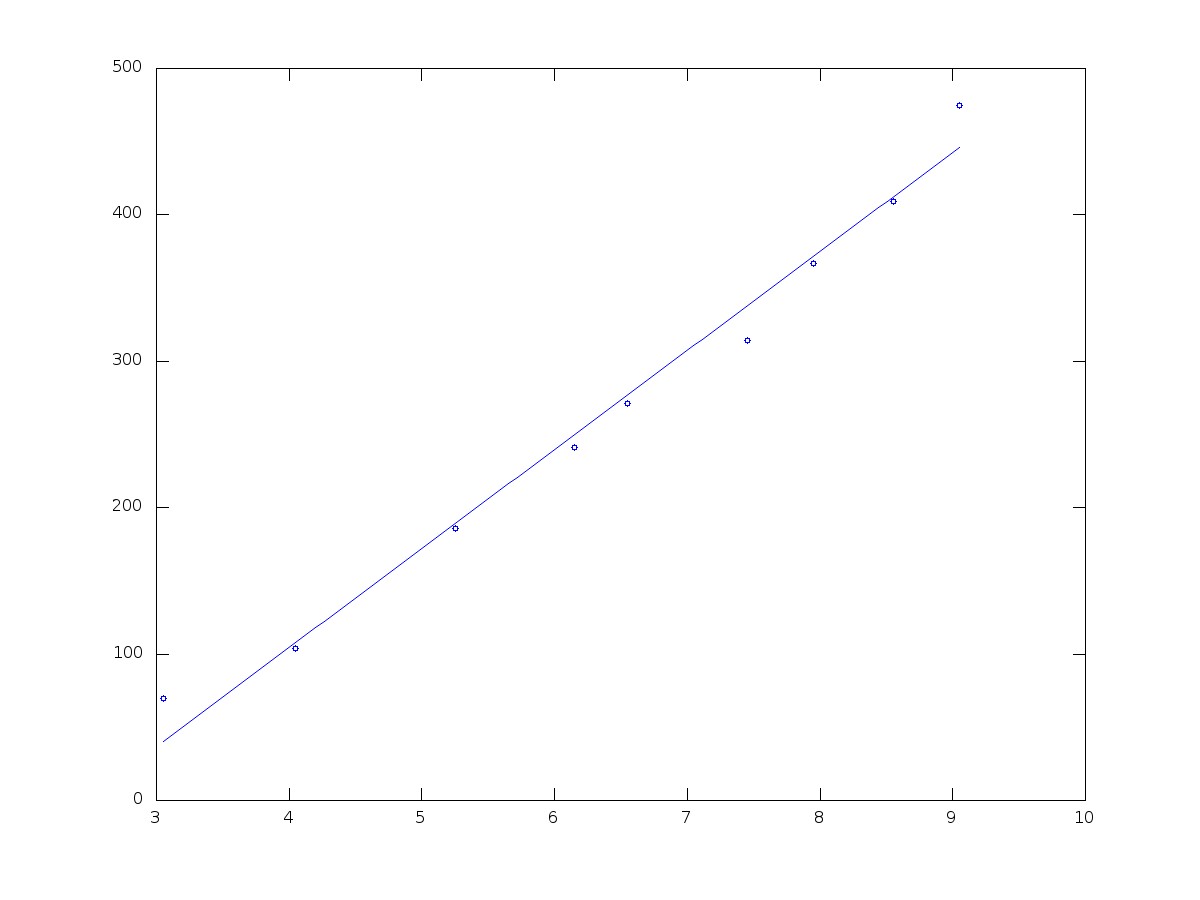
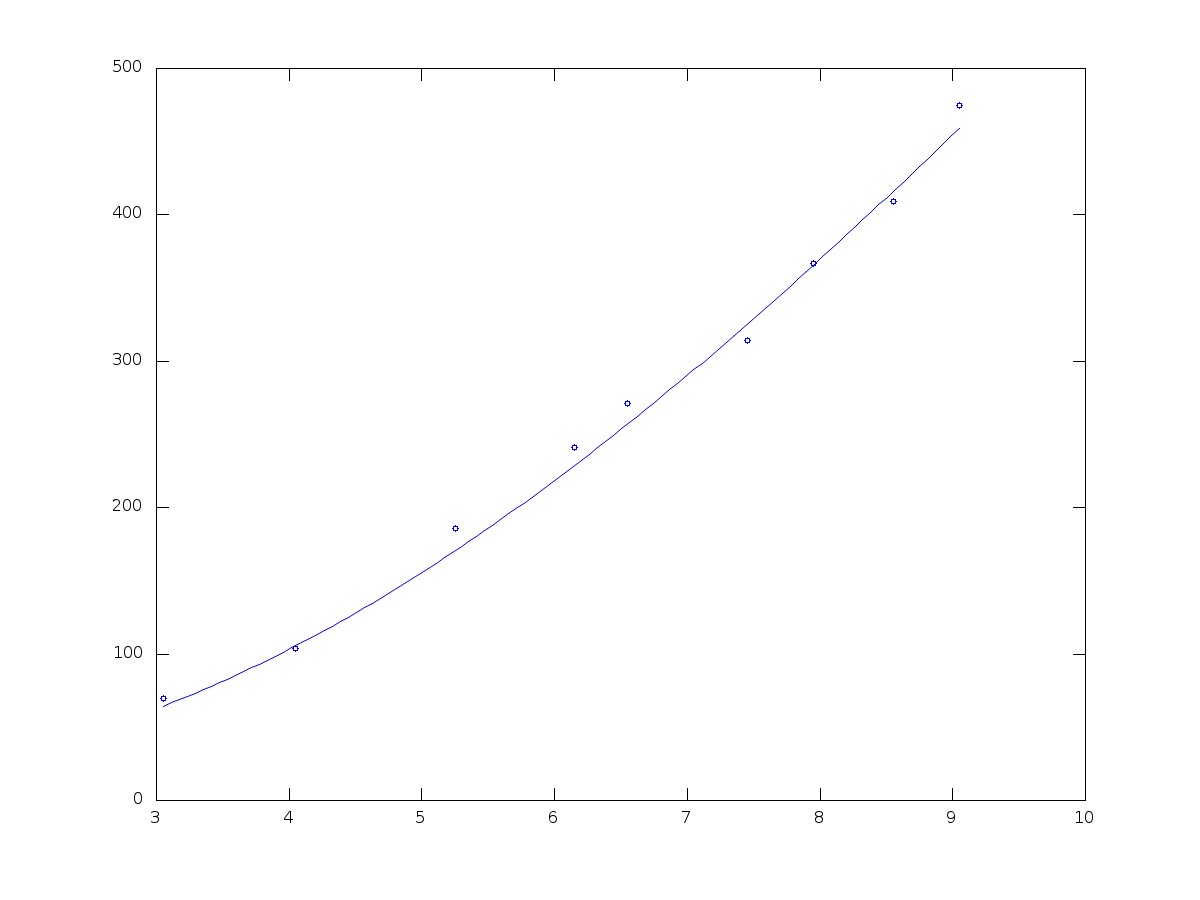
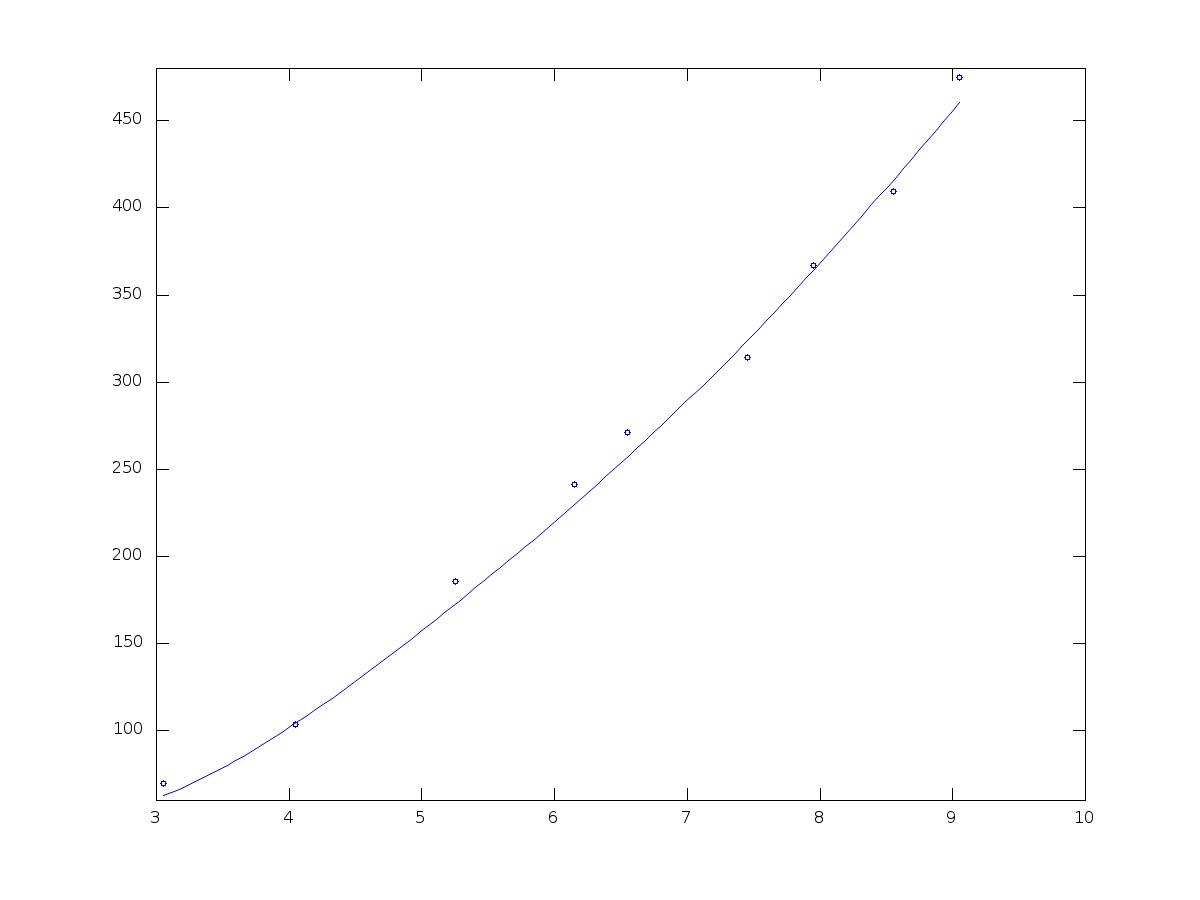
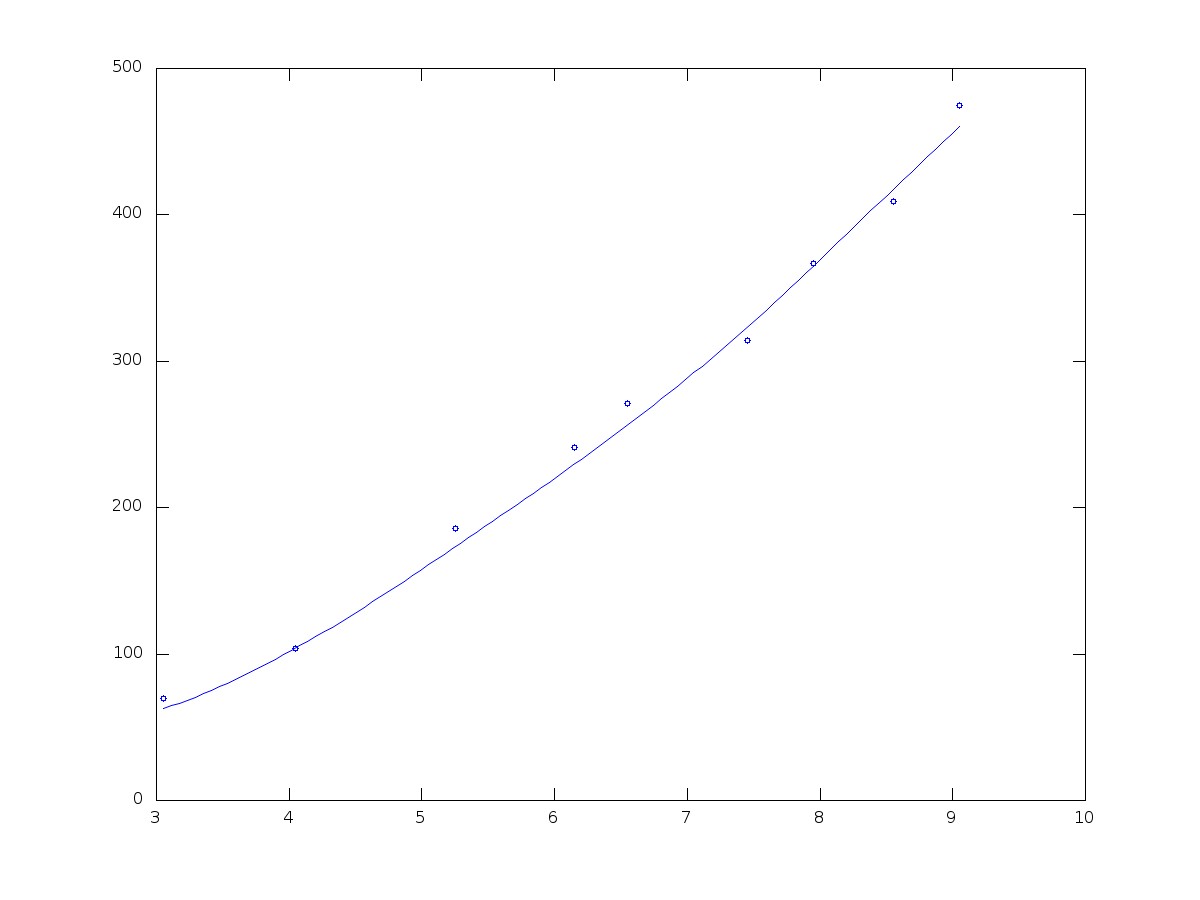
Plot of Height VS Time - Small Training Set - 0 Degree Polynomial fitting Plot of Height VS Time - Small Training Set - 1 Degree Polynomial fitting Plot of Height VS Time - Small Training Set - 2 Degree Polynomial fitting Plot of Height VS Time - Small Training Set - 3 Degree Polynomial fitting Plot of Height VS Time - Small Training Set - 5 Degree Polynomial fitting Plot of Height VS Time - Small Training Set - 9 Degree Polynomial fitting
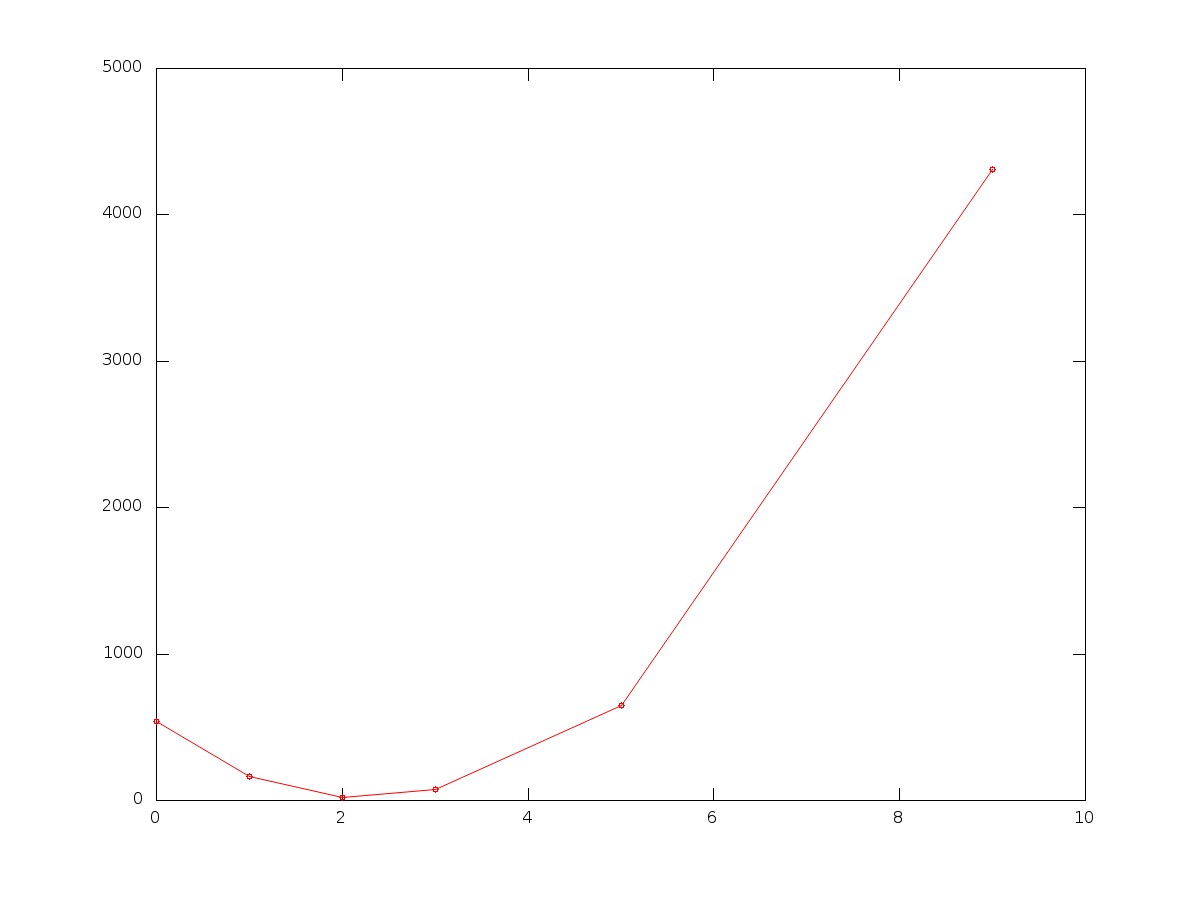
Training data Error VS Degree Plot :
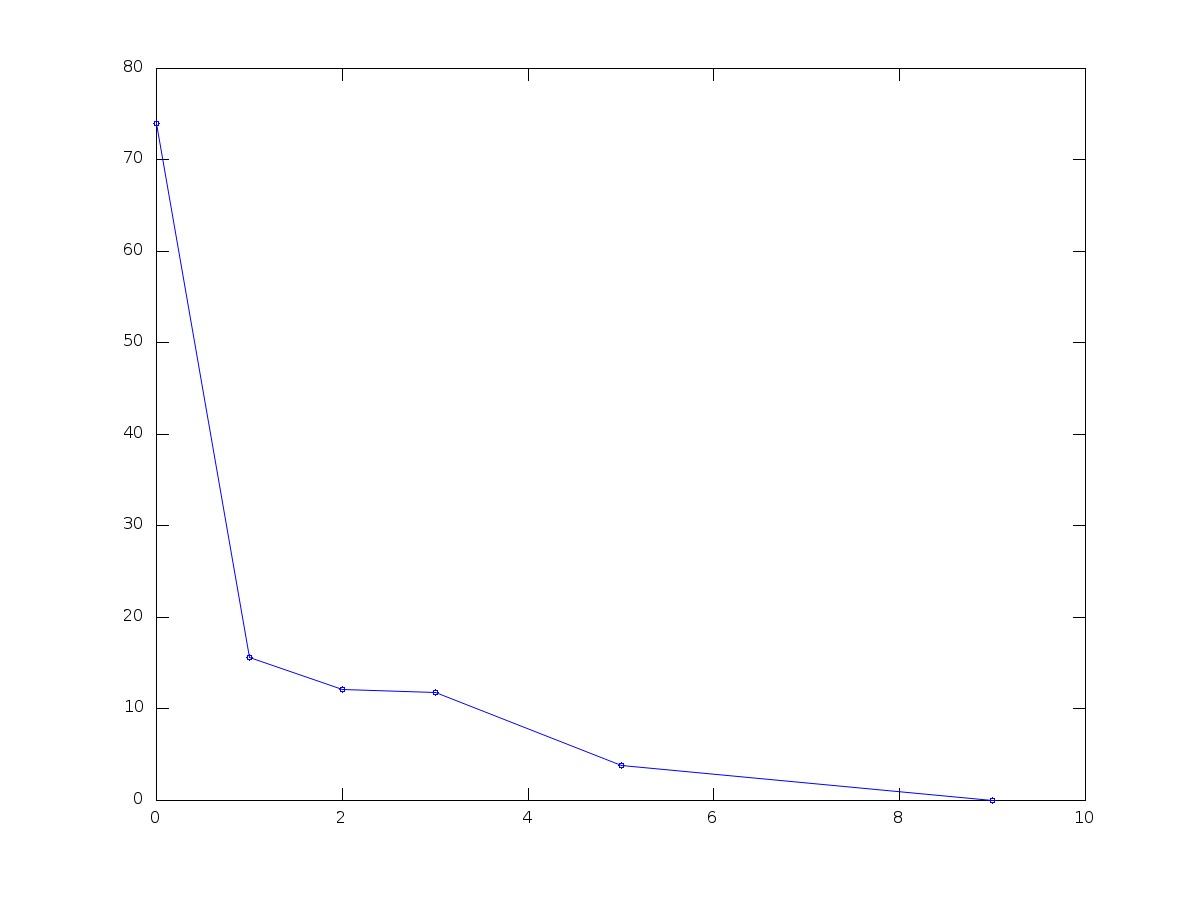
Plot of Error(RMS) VS Degree - Small Training Set
The above Error VS Degree plot of Training data shows minimum error at degree = 9 because a 9 degree polynomial can exactly fit 10 data points.
The polynomial coefficients for various degrees polynomials :
Degree
p0
p1
p2
p3
p4
p5
p6
p7
p8
p9
0
156.45
1
50.37
-82.82
2
5.40
-0.93
27.89
3
1.26
-12.54
79.68
-85.14
4
3.88
-90.91
827.59
-3647.90
7804.80
-6420.10
5
-2.53
109.27
-2070.44
22595.02
-156416.60
711845.77
-2128283.16
4028322.82
-4377092.00
2079030.46
Test data Polynomial fitting Plots :
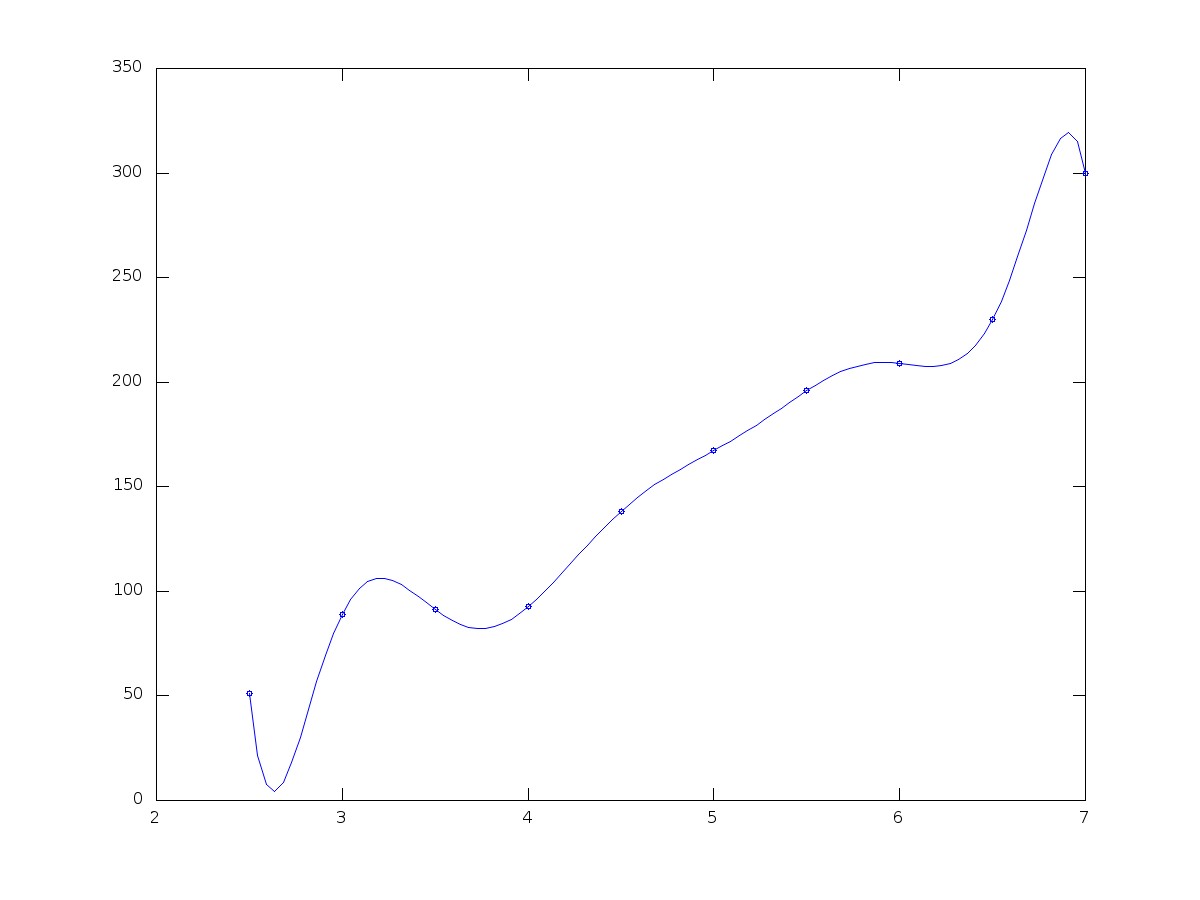
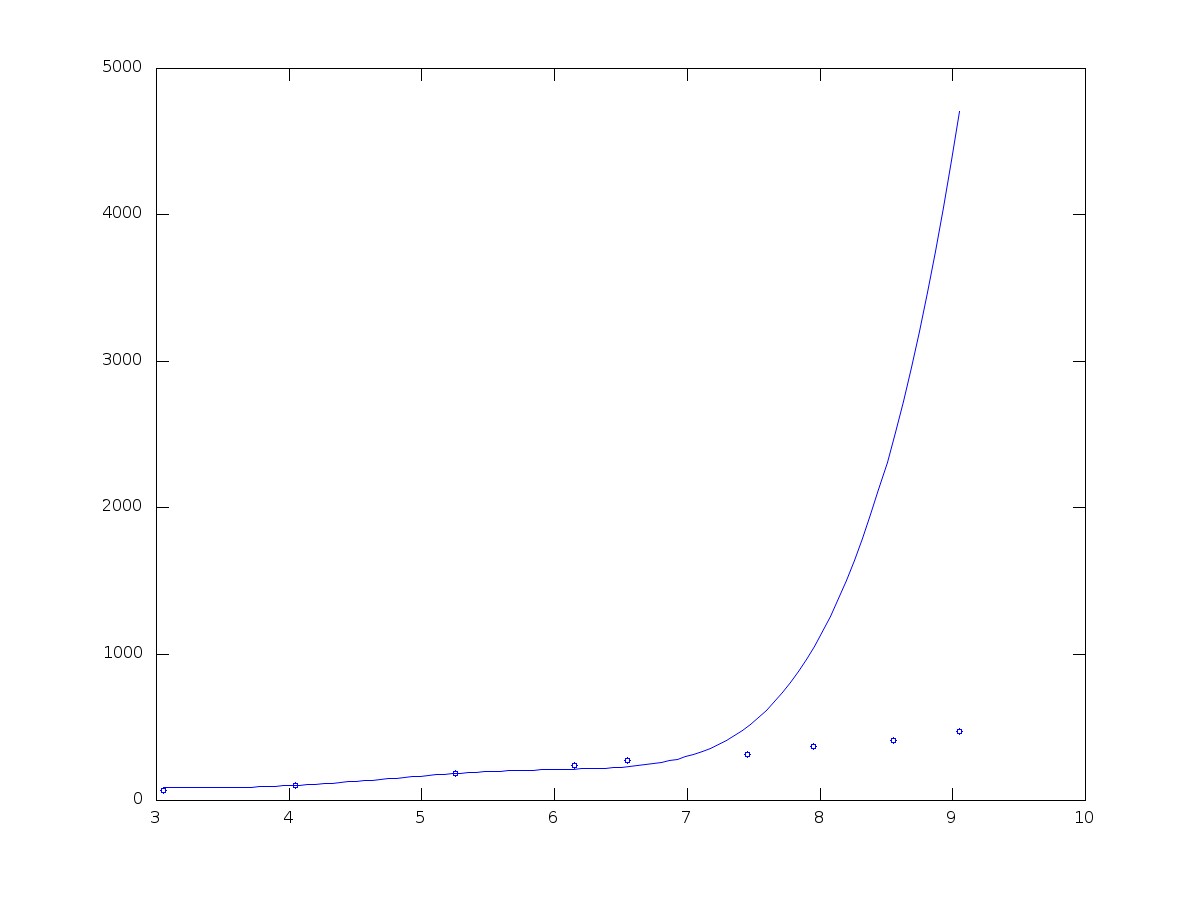
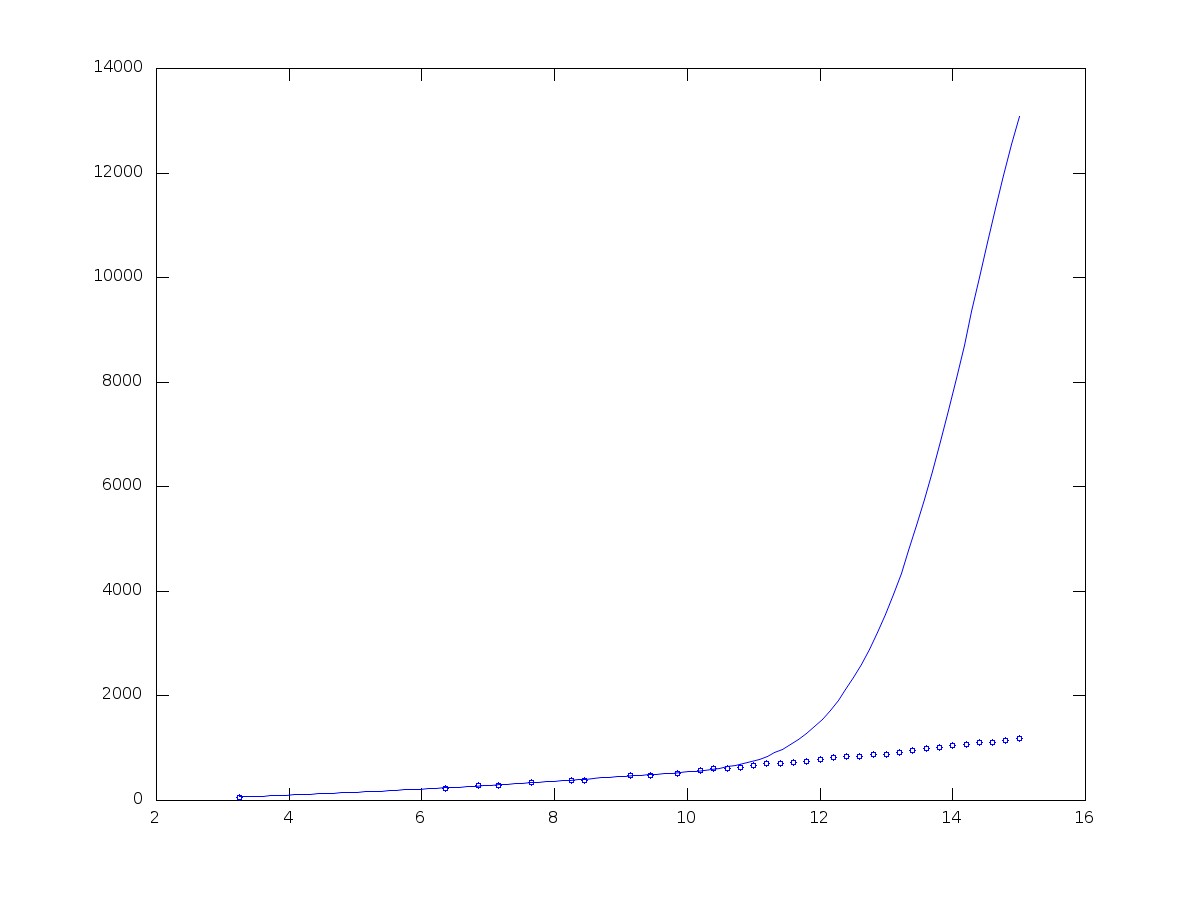
Plot of Height VS Time - Test Set - 0 Degree Polynomial fitting Plot of Height VS Time - Test Set - 1 Degree Polynomial fitting Plot of Height VS Time - Test Set - 2 Degree Polynomial fitting Plot of Height VS Time - Test Set - 3 Degree Polynomial fitting Plot of Height VS Time - Test Set - 5 Degree Polynomial fitting Plot of Height VS Time - Test Set - 9 Degree Polynomial fitting
Test data Error VS Degree Plot :
Plot of Error(RMS) VS Degree - Test Set
Degree
Error
0
629.41
1
281.25
2
24.913
3
631.06
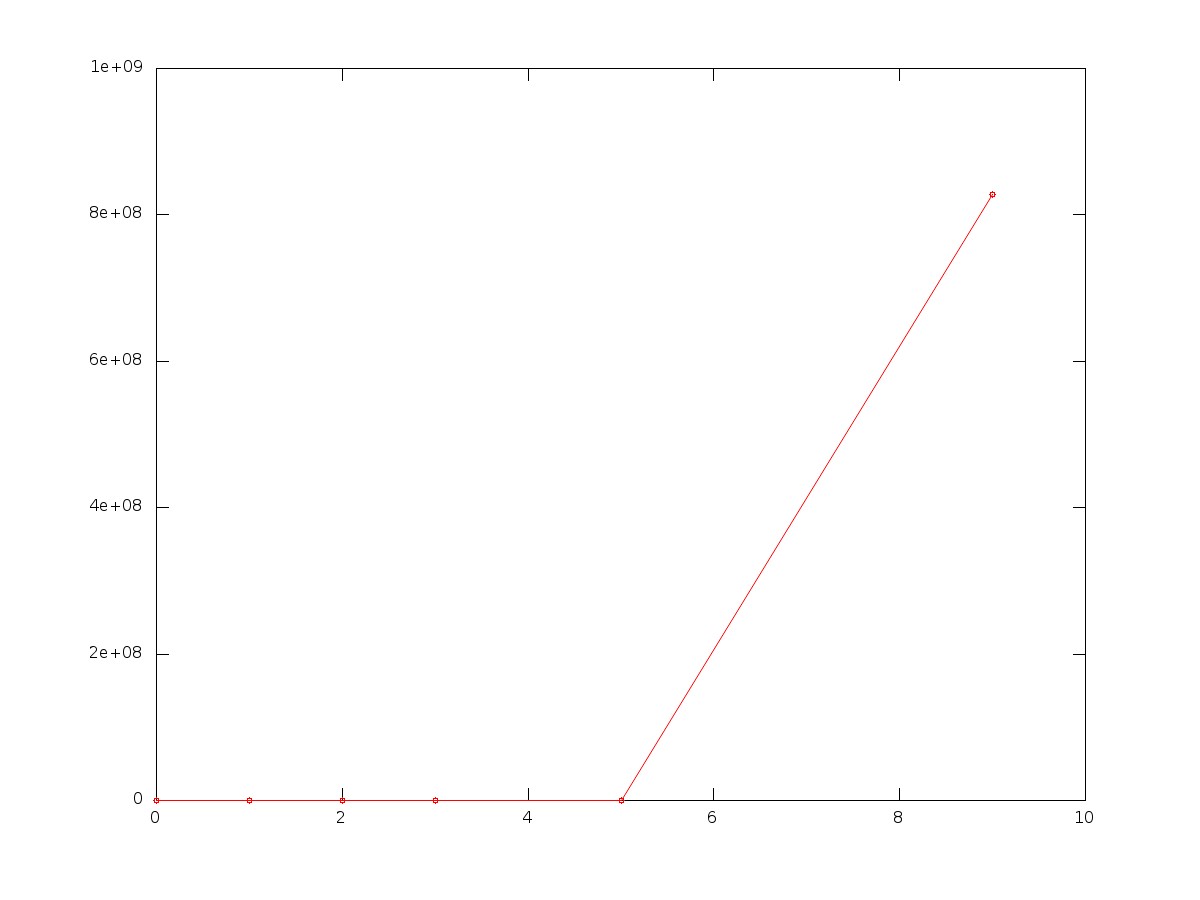
5
1.6284e+05
9
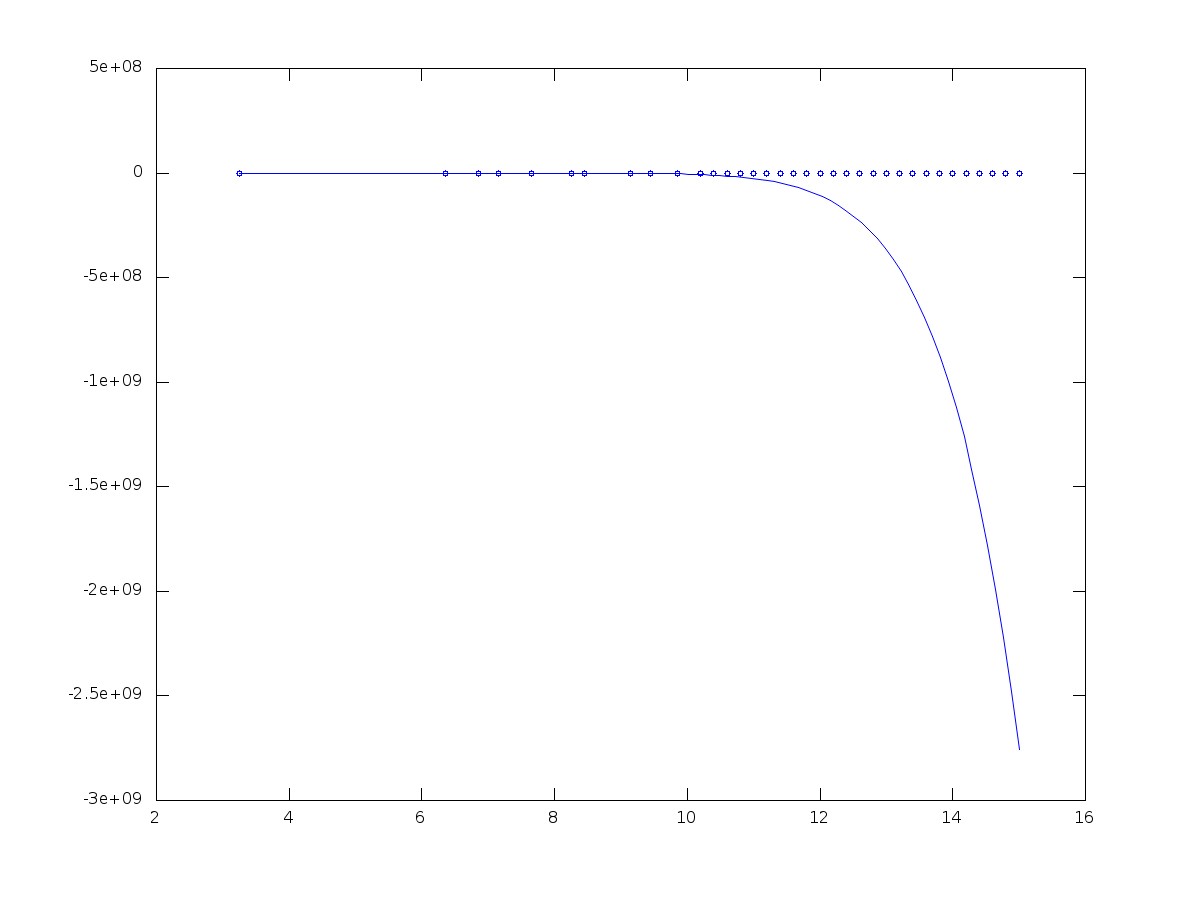
8.2795e+08
The above Error table for test data shows minimum error at degree=2 which is different from that given by Training data.
Validation data Polynomial fitting Plots :
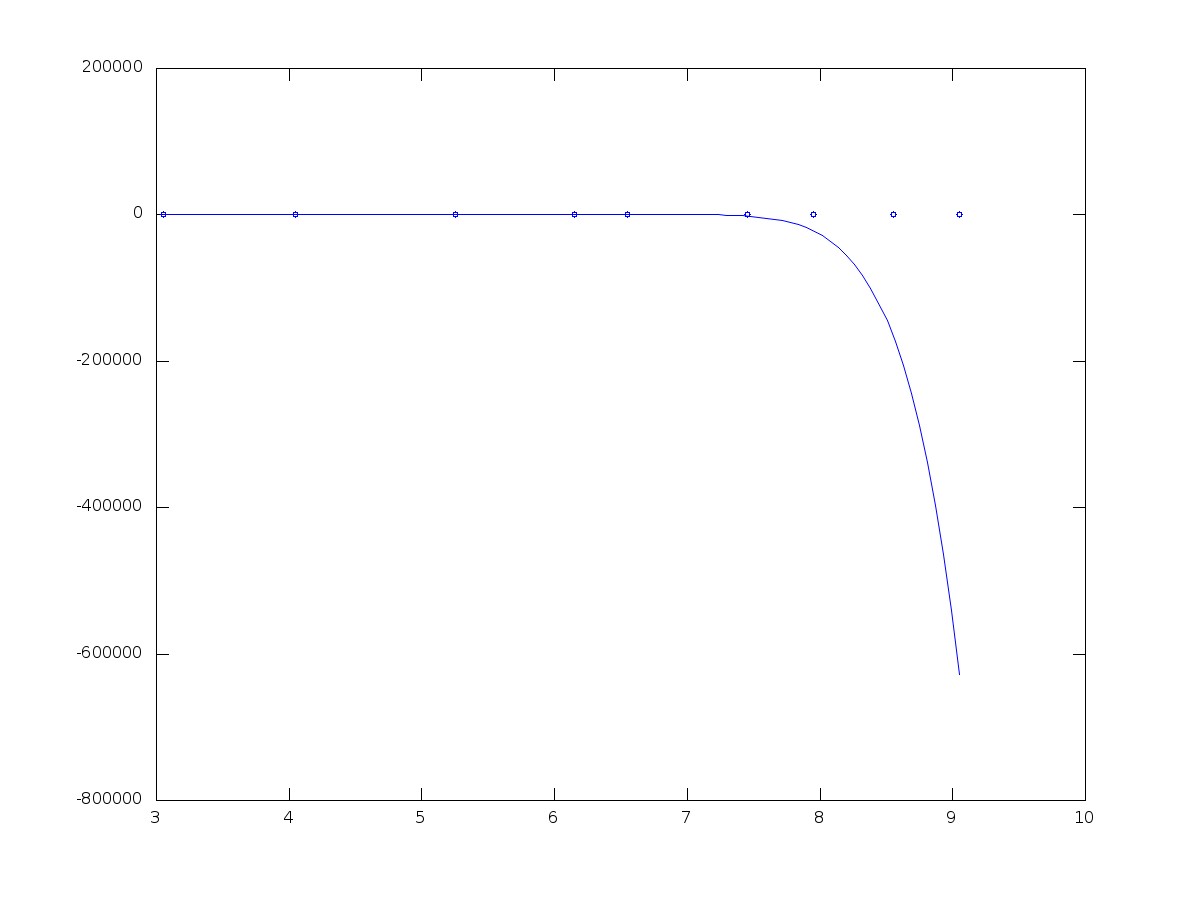
Plot of Height VS Time - Validation Set - 0 Degree Polynomial fitting Plot of Height VS Time - Validation Set - 1 Degree Polynomial fitting Plot of Height VS Time - Validation Set - 2 Degree Polynomial fitting Plot of Height VS Time - Validation Set - 3 Degree Polynomial fitting Plot of Height VS Time - Validation Set - 5 Degree Polynomial fitting Plot of Height VS Time - Validation Set - 9 Degree Polynomial fitting
Validation data Error VS Degree Plot :
Plot of Error(RMS) VS Degree - Validation Set
Degree
Error
0
171.88
1
44.857
2
11.091
3
32.868
5
1585.8
9
2.1658e+05
The above Error table for Validation data shows minimum error at degree=2 which is different from that given by Training data.
Big Training Data
Training data Polynomial fitting Plots :
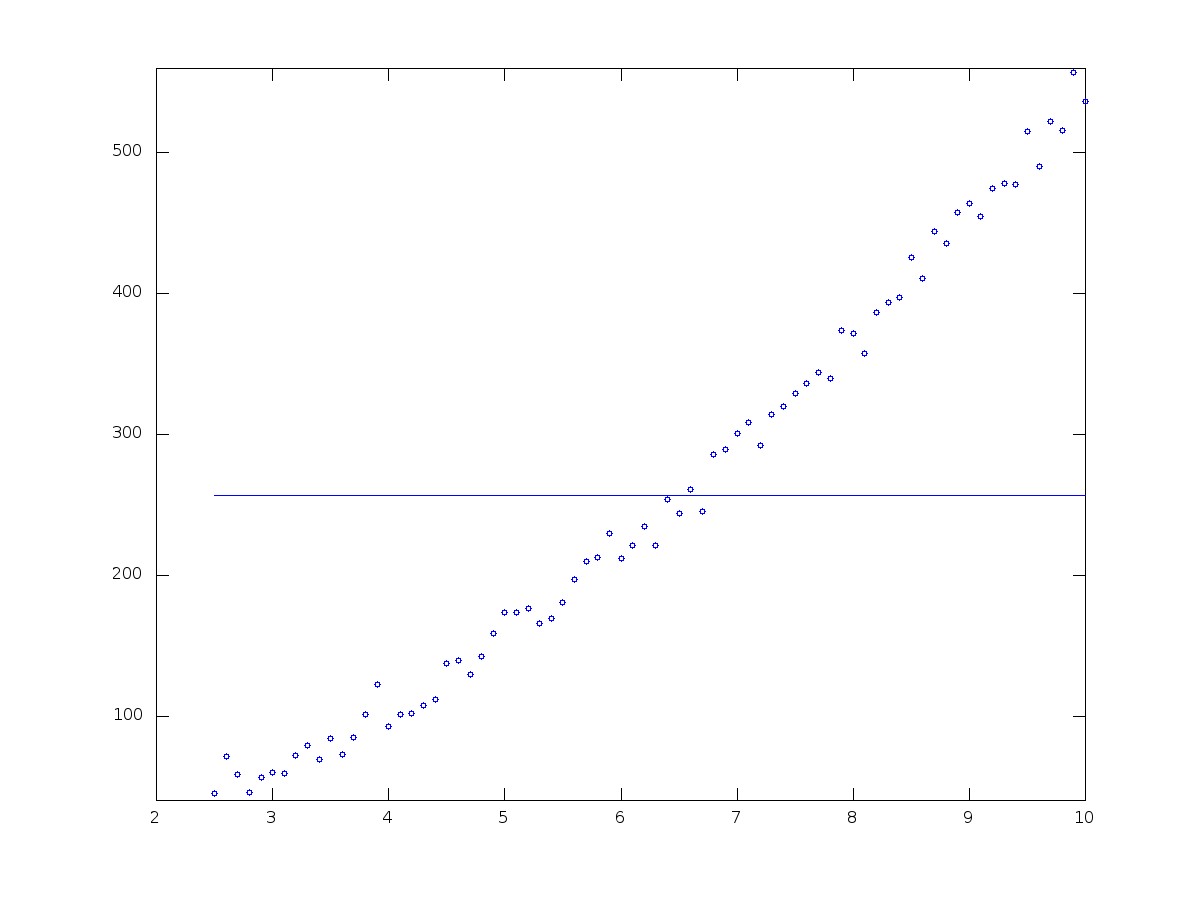
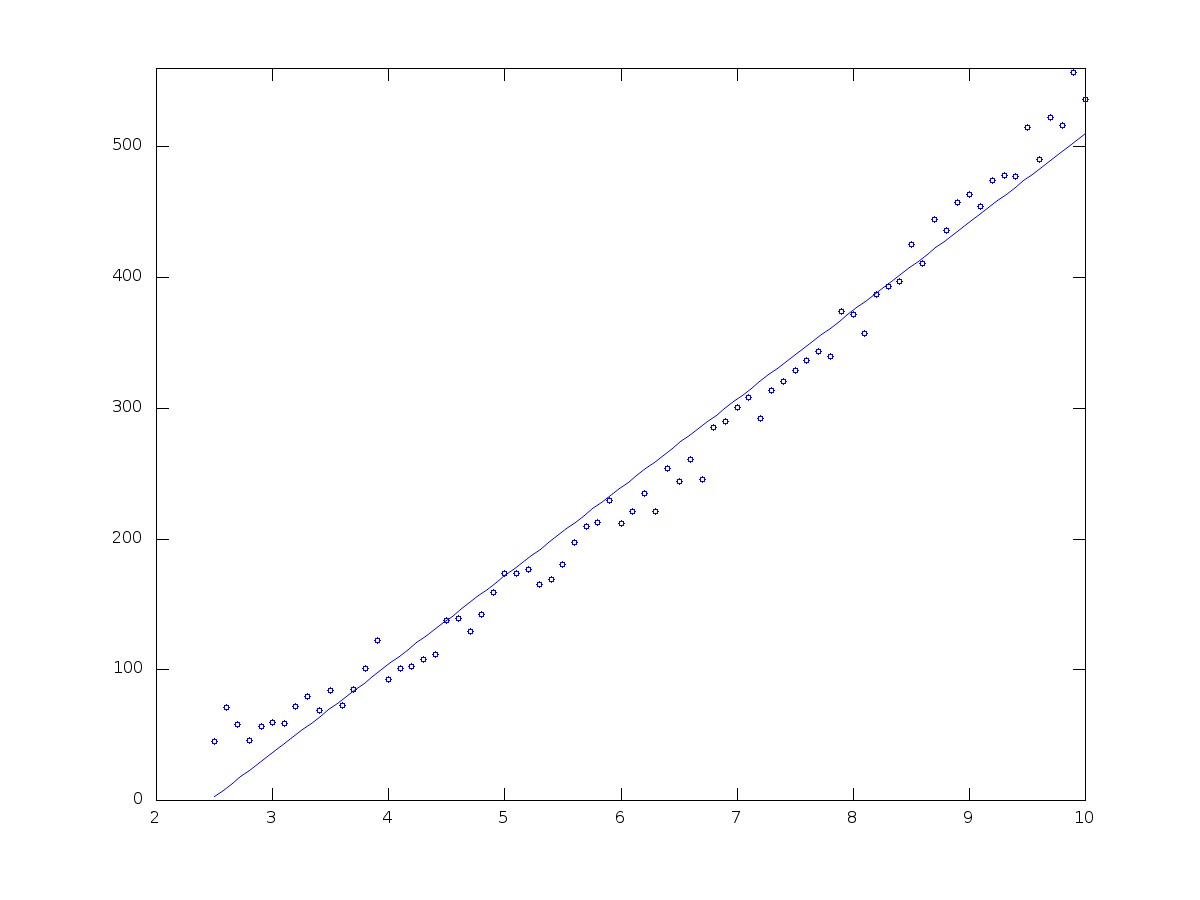
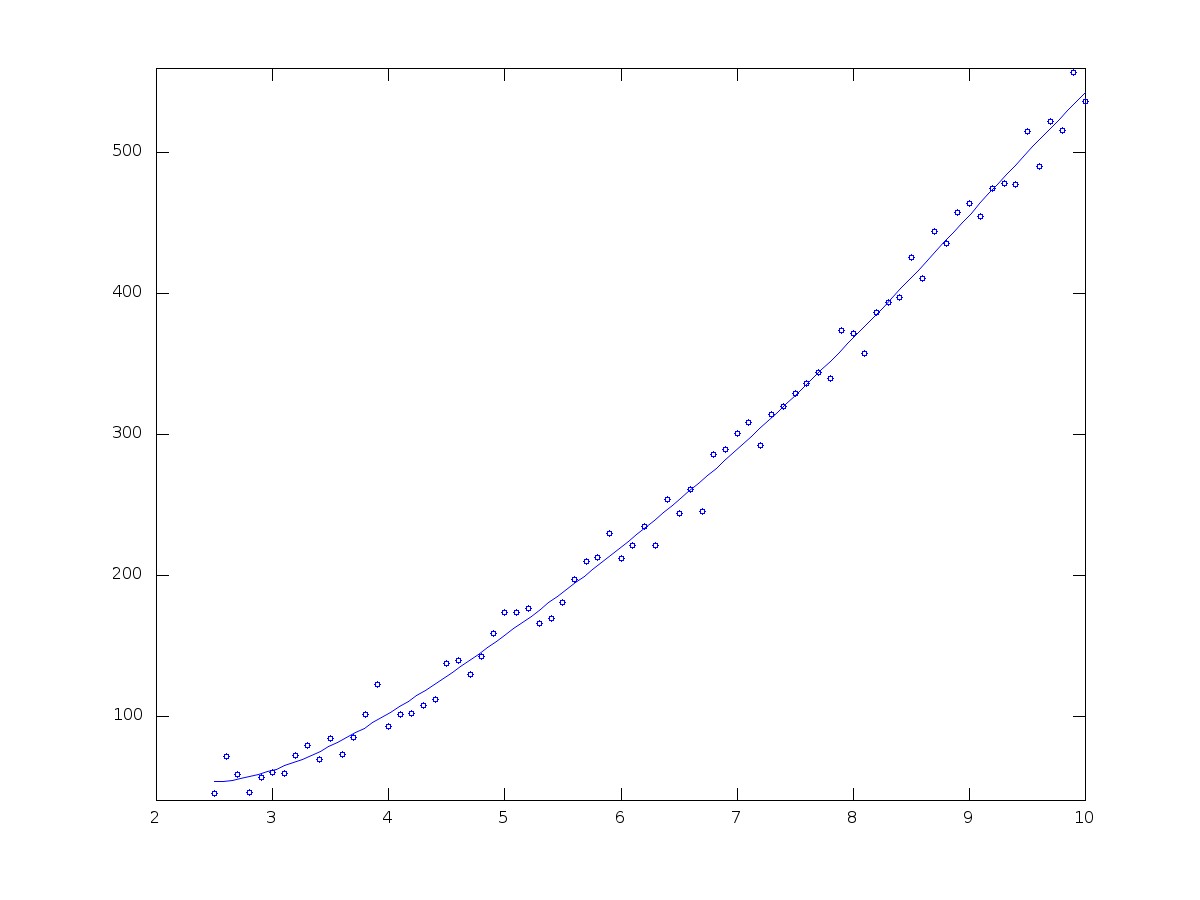
Plot of Height VS Time - Big Training Set - 0 Degree Polynomial fitting Plot of Height VS Time - Big Training Set - 1 Degree Polynomial fitting Plot of Height VS Time - Big Training Set - 2 Degree Polynomial fitting Plot of Height VS Time - Big Training Set - 3 Degree Polynomial fitting Plot of Height VS Time - Big Training Set - 5 Degree Polynomial fitting Plot of Height VS Time - Big Training Set - 9 Degree Polynomial fitting
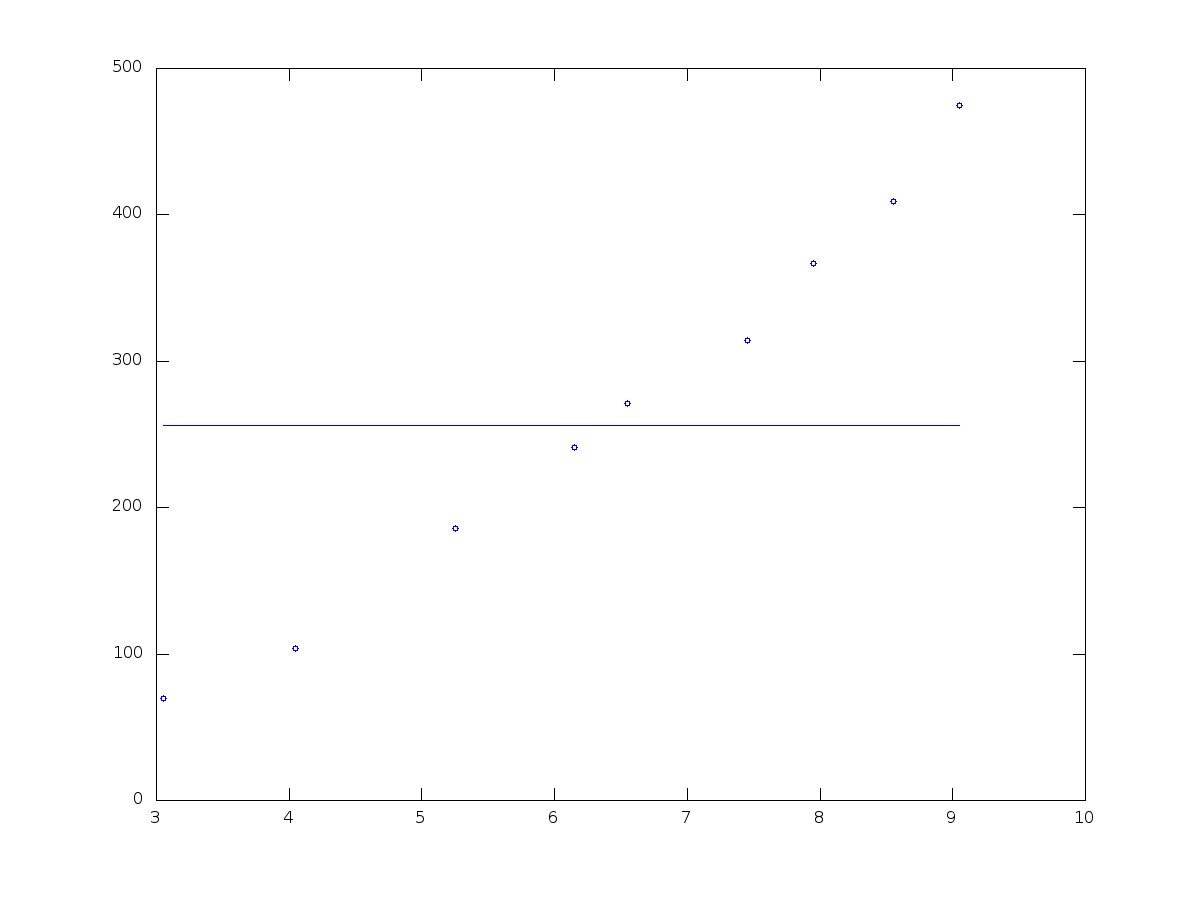
Training data Error VS Degree Plot :
Plot of Error(RMS) VS Degree - Big Training Set
The above Error VS Degree plot of Training data shows minimum error at degree = 5.
The polynomial coefficients for various degrees polynomials :
Degree
p0
p1
p2
p3
p4
p5
p6
p7
p8
p9
0
256.383862
1
67.626790
-166.283575
2
4.285670
14.055919
-19.499389
3
-0.247676
8.929590
-12.823587
27.562100
4
-0.046836
1.508508
-18.914533
119.167071
-321.411225
353.084081
5
-0.000214
0.013483
-0.359756
5.355511
-49.143347
289.251587
-1098.089774
2619.872519
-3575.612303
2168.675046
Test data Polynomial fitting Plots :
Plot of Height VS Time - Test Set - 0 Degree Polynomial fitting Plot of Height VS Time - Test Set - 1 Degree Polynomial fitting Plot of Height VS Time - Test Set - 2 Degree Polynomial fitting Plot of Height VS Time - Test Set - 3 Degree Polynomial fitting Plot of Height VS Time - Test Set - 5 Degree Polynomial fitting Plot of Height VS Time - Test Set - 9 Degree Polynomial fitting
Test data Error VS Degree Plot :
Plot of Error(RMS) VS Degree - Test Set
Degree
Error
0
542.48
1
166.93
2
19.201
3
77.05
5
648.65
9
4311.3
The above Error table for test data shows minimum error at degree=2 which is different from that given by Training data.
Validation data Polynomial fitting Plots :
Plot of Height VS Time - Validation Set - 0 Degree Polynomial fitting Plot of Height VS Time - Validation Set - 1 Degree Polynomial fitting Plot of Height VS Time - Validation Set - 2 Degree Polynomial fitting Plot of Height VS Time - Validation Set - 3 Degree Polynomial fitting Plot of Height VS Time - Validation Set - 5 Degree Polynomial fitting Plot of Height VS Time - Validation Set - 9 Degree Polynomial fitting
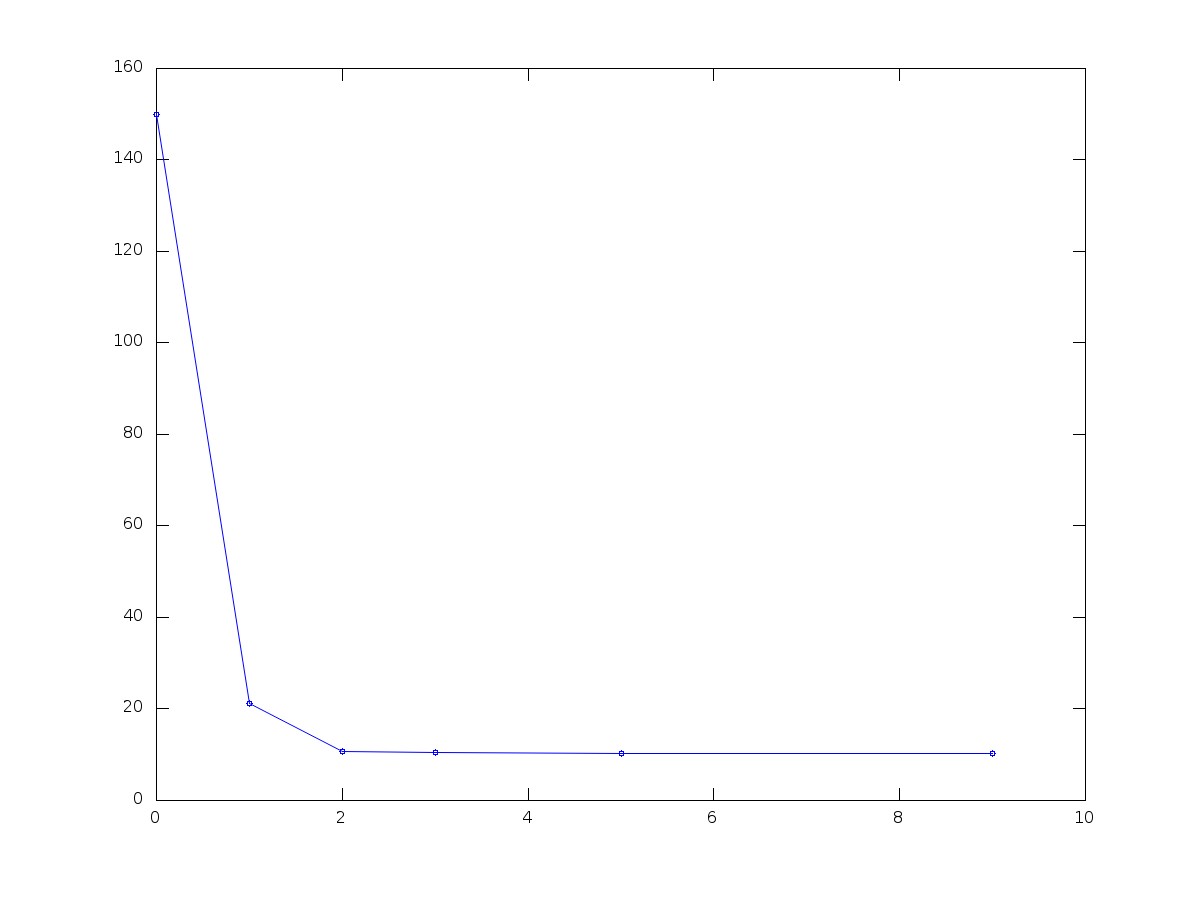
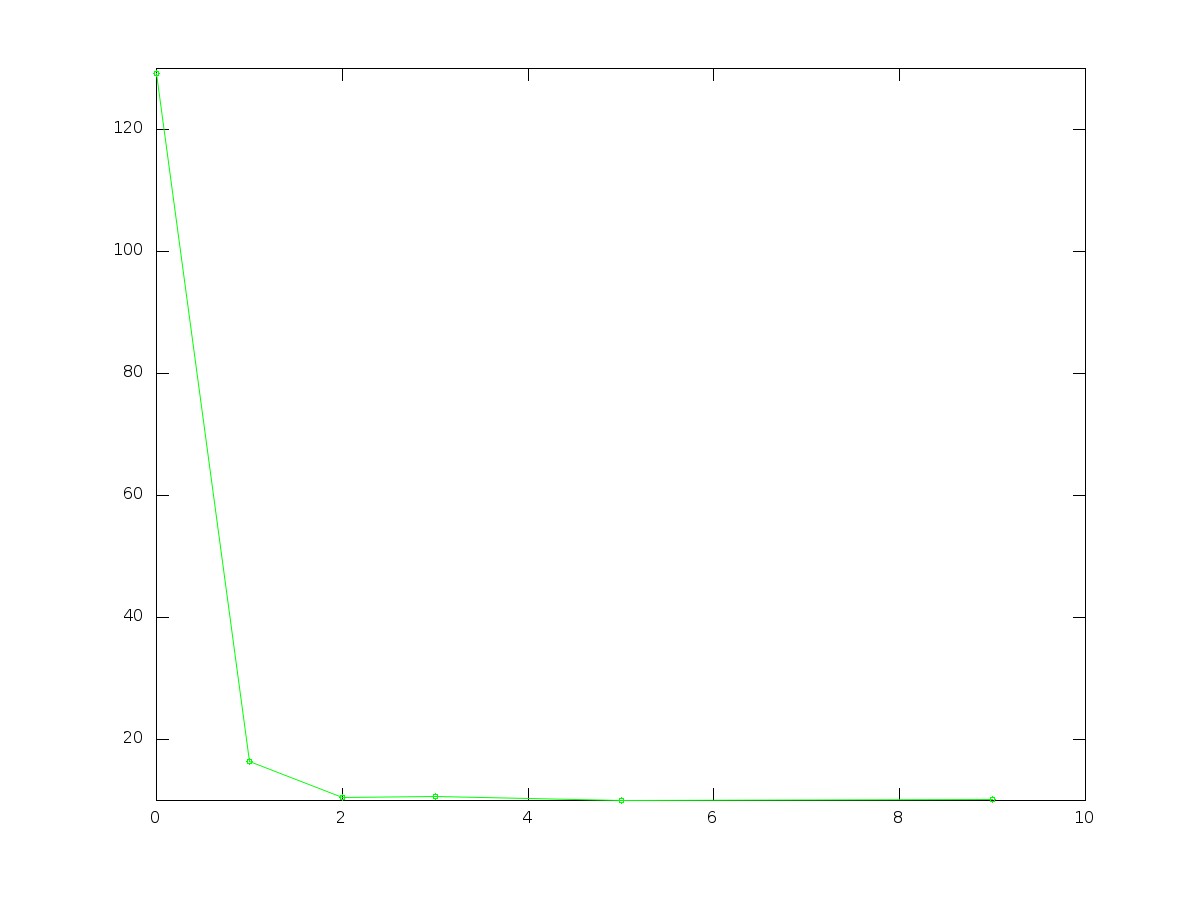
Validation data Error VS Degree Plot :
Plot of Error(RMS) VS Degree - Validation Set
Degree
Error
0
129.14
1
16.419
2
10.439
3
10.686
5
10.017
9
10.13
The above Error table for Validation data shows minimum error at degree=5 which is same as that given by Training data but different than what is given by Test data.
Final Analysis and Conclusion
Case 1 : Small Training data
Here we found that a 9 degree polynomial accurately fitted the training data but went abruptly wrong with Test data. This was due to overfitting. However the Validation data predicted Degree 2(i.e. Quadratic) to be the best fitting polynomial in terms of least error, which went well with the Test data too. So, the optimal degree is N=2.
Case 2 : Big Training data
Here the degree of the polynomial that fitted training data the best was 5 which was not the case when we tried it on Test data. Although, the validation set here also approved degree 5(but that is a little lead from other polynomials since the errors are very close to each other) polynomial to be the best fit, and that is because it has data points which are close in range to those of the training data. Test data, which is well spread, gave minimum error on degree 2 polynomial. Hence the optimal degree is N=2.
Conclusion:
From both the cases, considering the right importance and relevance of the training, validation and test data sets, we conclude that the optimal degree polynomial that fits the Height and Time data of a ball is 2 i.e. a quadratic polynomial which is much the actual case except for the noise added to it.
CODE USED:
The file containing the Octave code used can be downloaded here