Dimensionality reduction techniques
Image Reconstruction for image 25 as a sum of obtained eigenvectors:
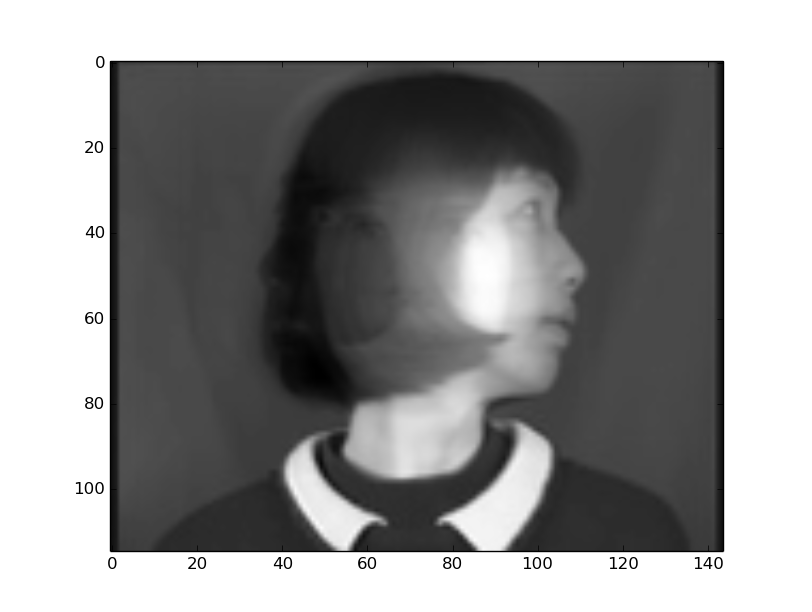
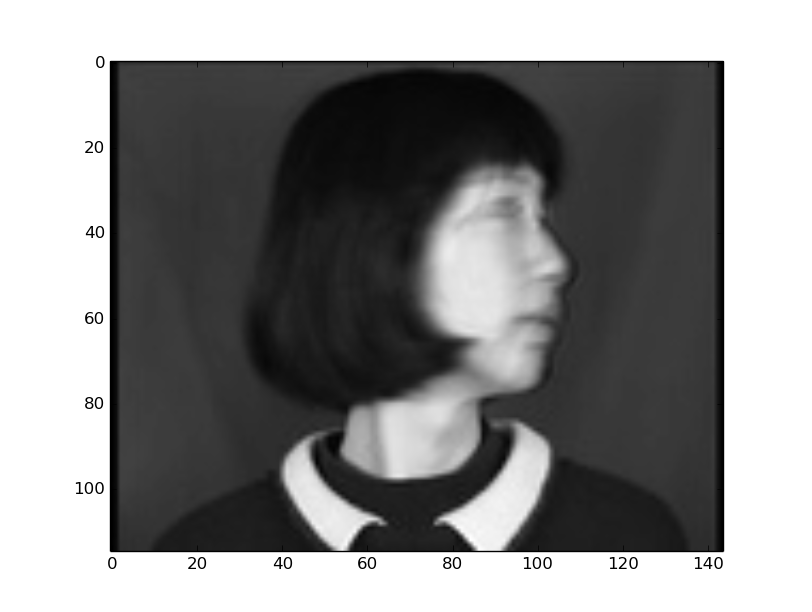
Original Image:
Reconstructed Image:
n =2 n = 10 n = 30 n = 80
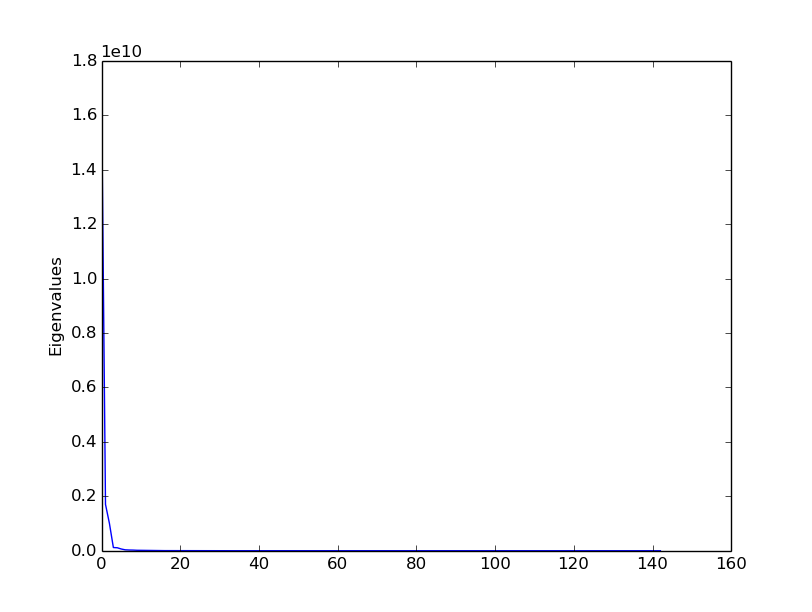
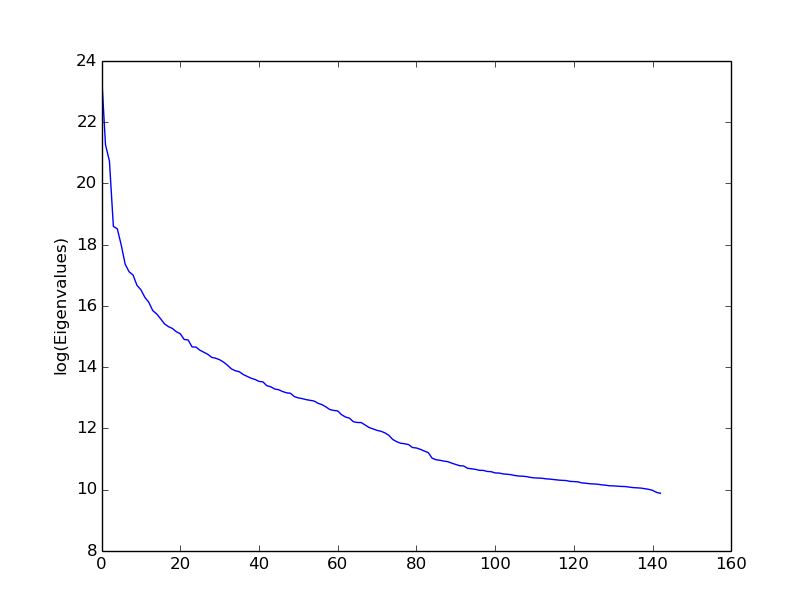
Plots for eigenvalues and log(eigenvalues)
The plots clearly show a sharp decrease in eigenvalues after n=2. This is obvious from the image data which contains images with the lady’s head tilting along horizontal axis with slight motion in the vertical direction too which causes the 2 eigenvectors to contain most of the information. The face reconstructed using information from 2 eigenvectors shows traces of the other images embedded in the image. As a larger number of eigenvectors is used the reconstructed image becomes closer to the original image.
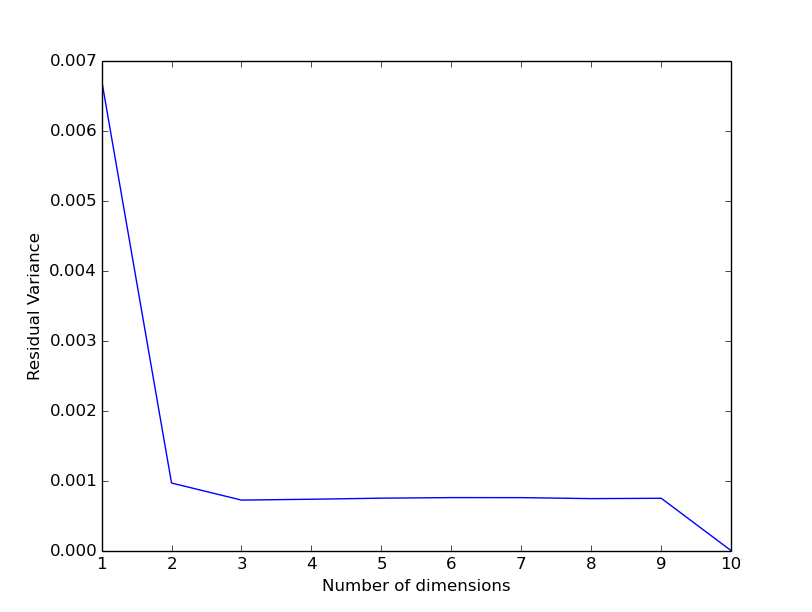
Plot of Residual Variance vs Dimensions for 5 nearest neighbours
Nearest neighbours of image 25
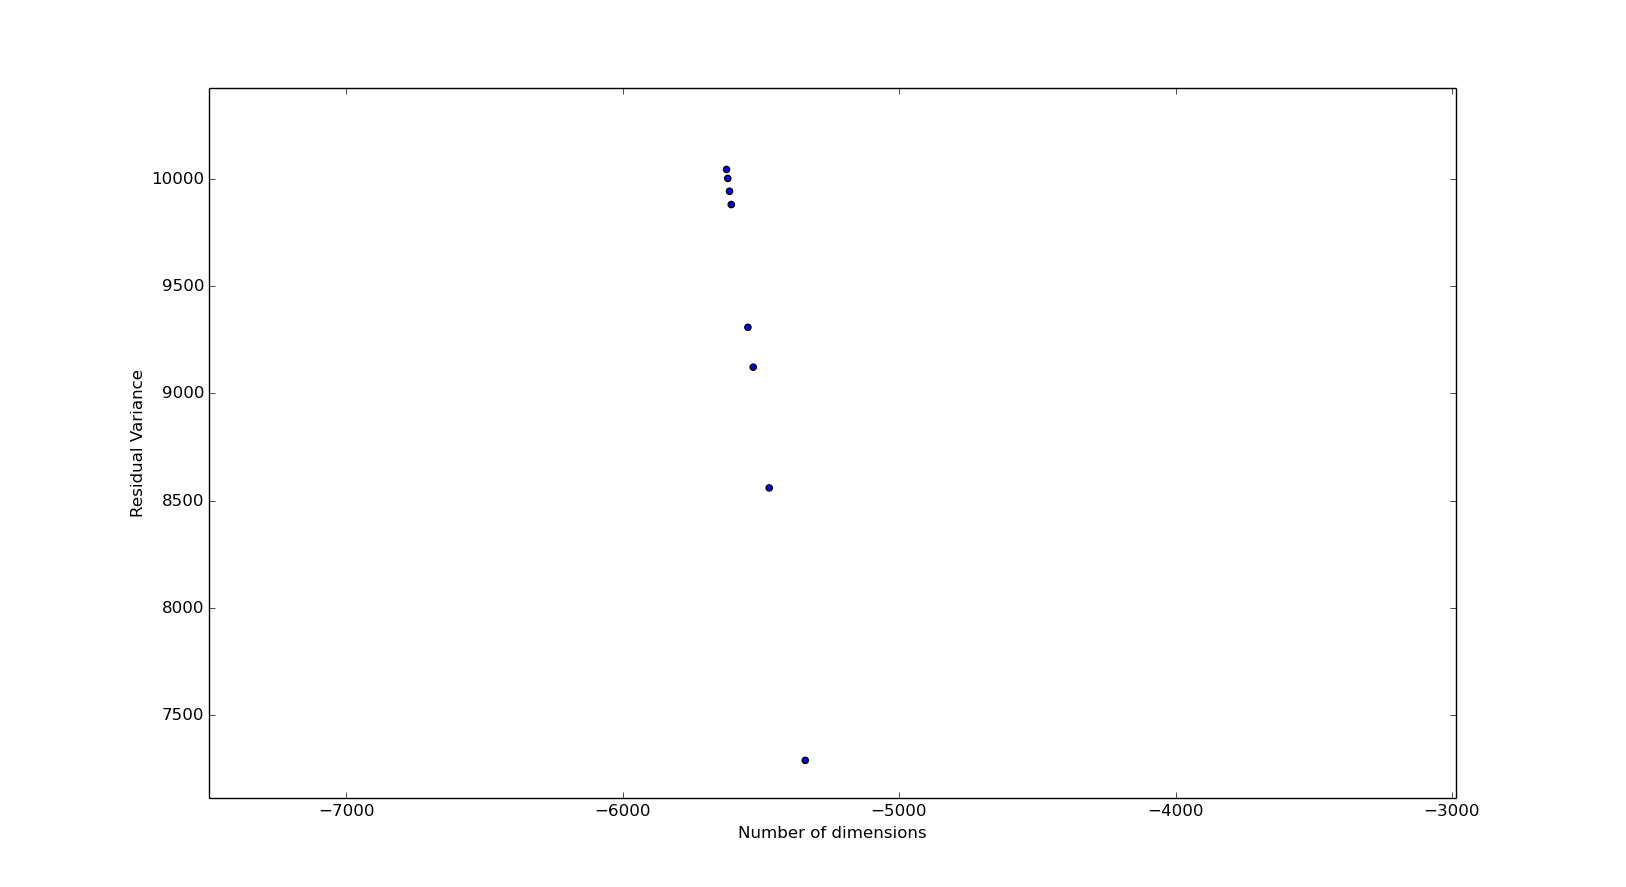
Zoomed plot near Image-10
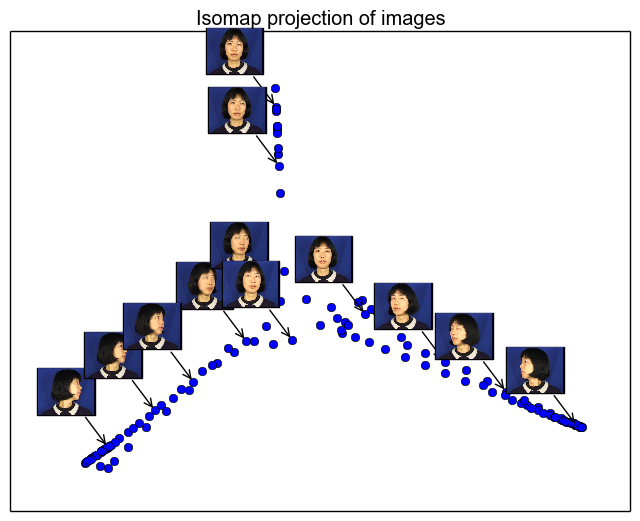
The inherent dimensionality of data is supposed to be 1 as the lady is swinging her head along only a single direction. The plot of residual variance shows that n = 2 is a better choice for dimensionality of the data as for higher dimensions the reduction in residual variance in not much. This can be attributed the slight upwards motion of the head during turning and unavoidable noise in the data. The isomap seperates the data into three different sections: each section contains images of the head in close orientations (i.e. facing the camera, looking towards right, looking towards left)
Find Code here