Homework 1
Part A. Small Data sets
Coefficients for polynomial obtained using ‘h1_train_small.csv’.
Degree | 0 | 1 | 2 | 3 | 5 | 9 |
w0 | 1.5645e+02 | -8.2819e+01 | 2.7887e+01 | -8.5143e+01 | -6.4201e+03 | 2.0790e+06 |
w1 | 5.0372e+01 | -9.3025e-01 | 7.9680e+01 | 7.8048e+03 | -4.3771e+06 | |
w2 | 5.4003e+00 | -1.2541e+01 | -3.6479e+03 | 4.0283e+06 | ||
w3 | 1.2590e+00 | 8.2759e+02 | -2.1283e+06 | |||
w4 | -9.0909e+01 | 7.1185e+05 | ||||
w5 | 3.8820e+00 | -1.5642e+05 | ||||
w6 | 2.2595e+04 | |||||
w7 | -2.0704e+03 | |||||
w8 | 1.0927e+02 | |||||
w9 | -2.5320e+00 |
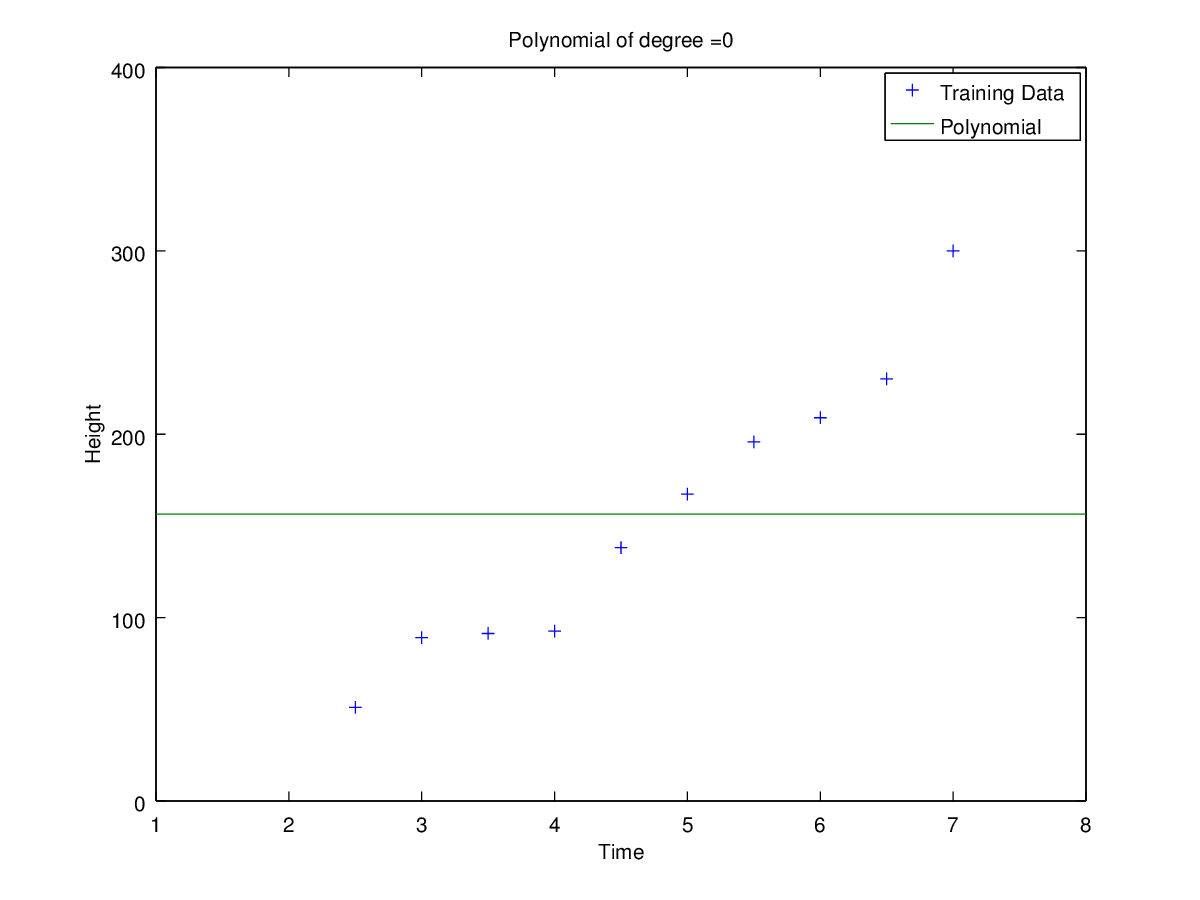
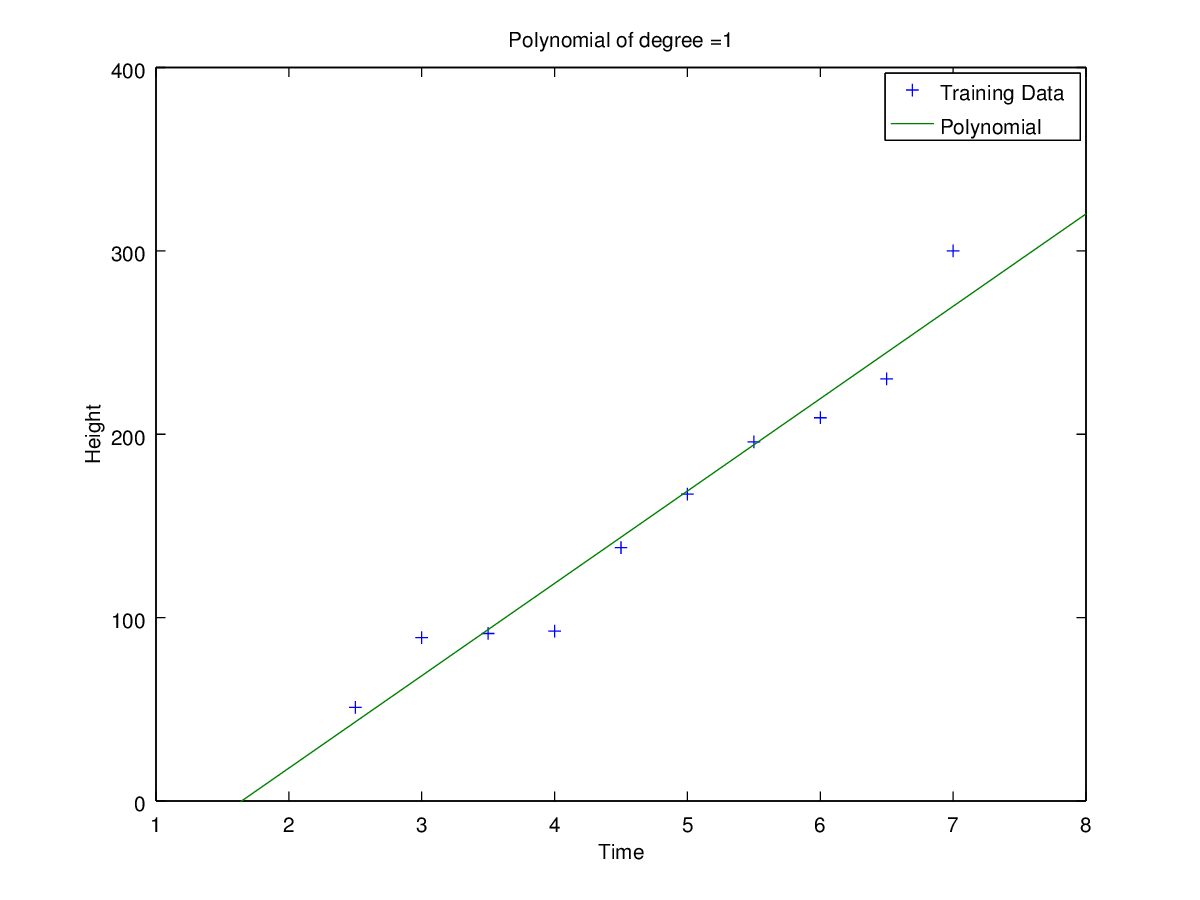
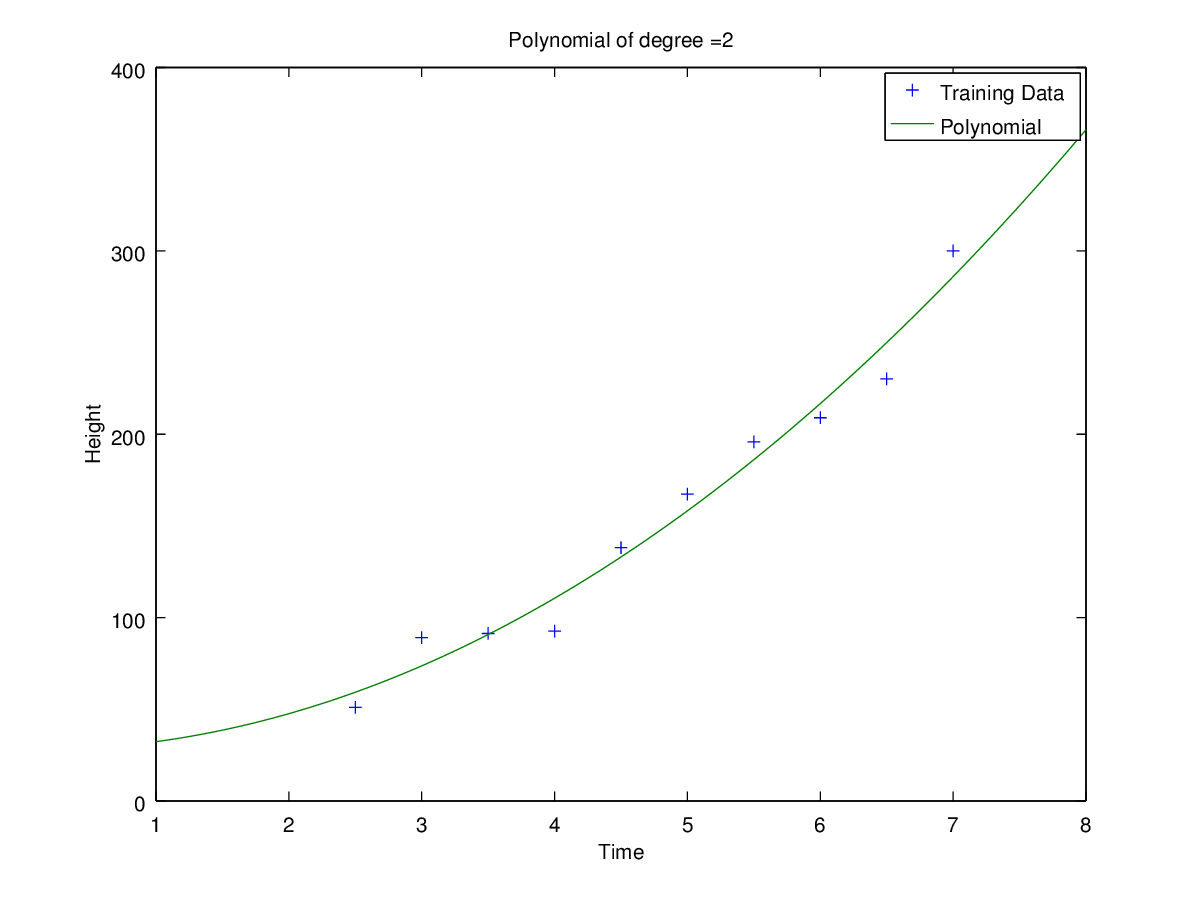
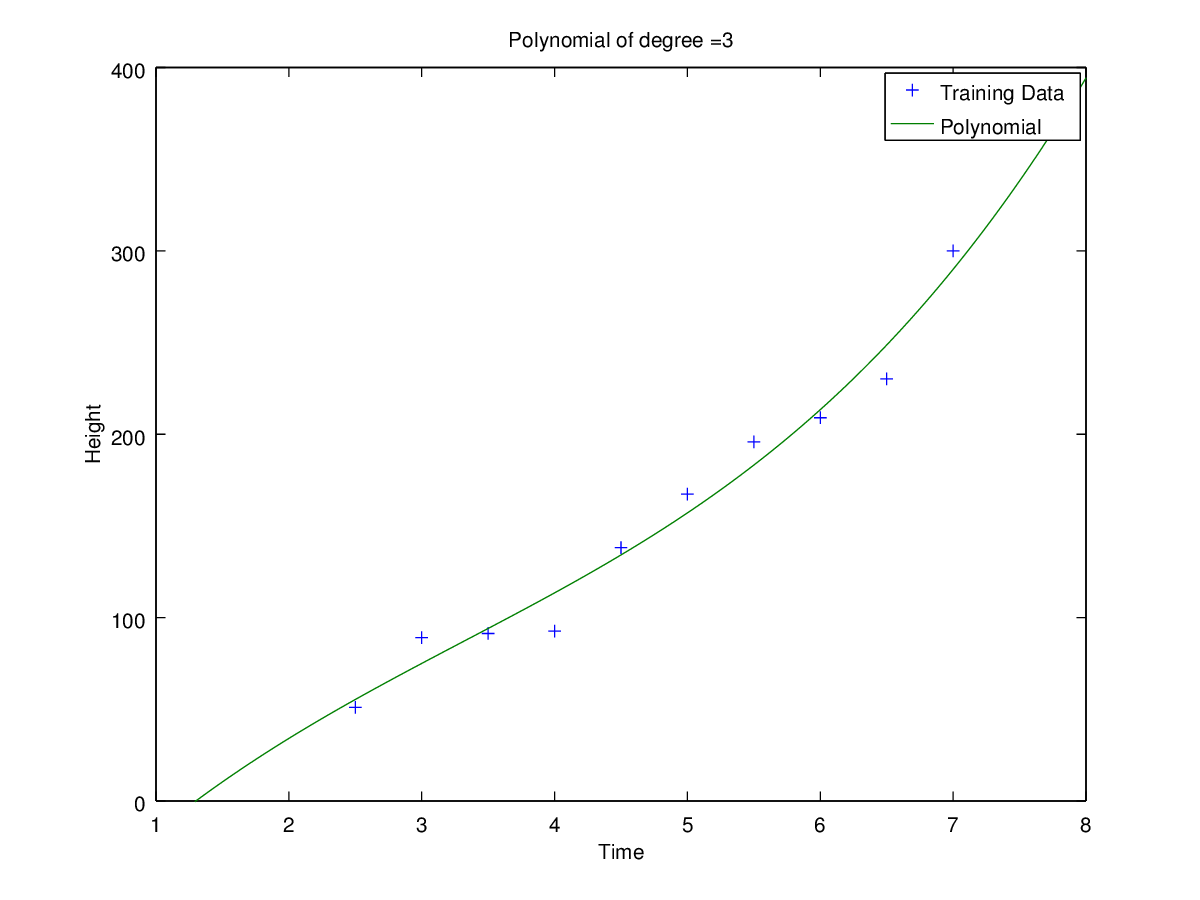
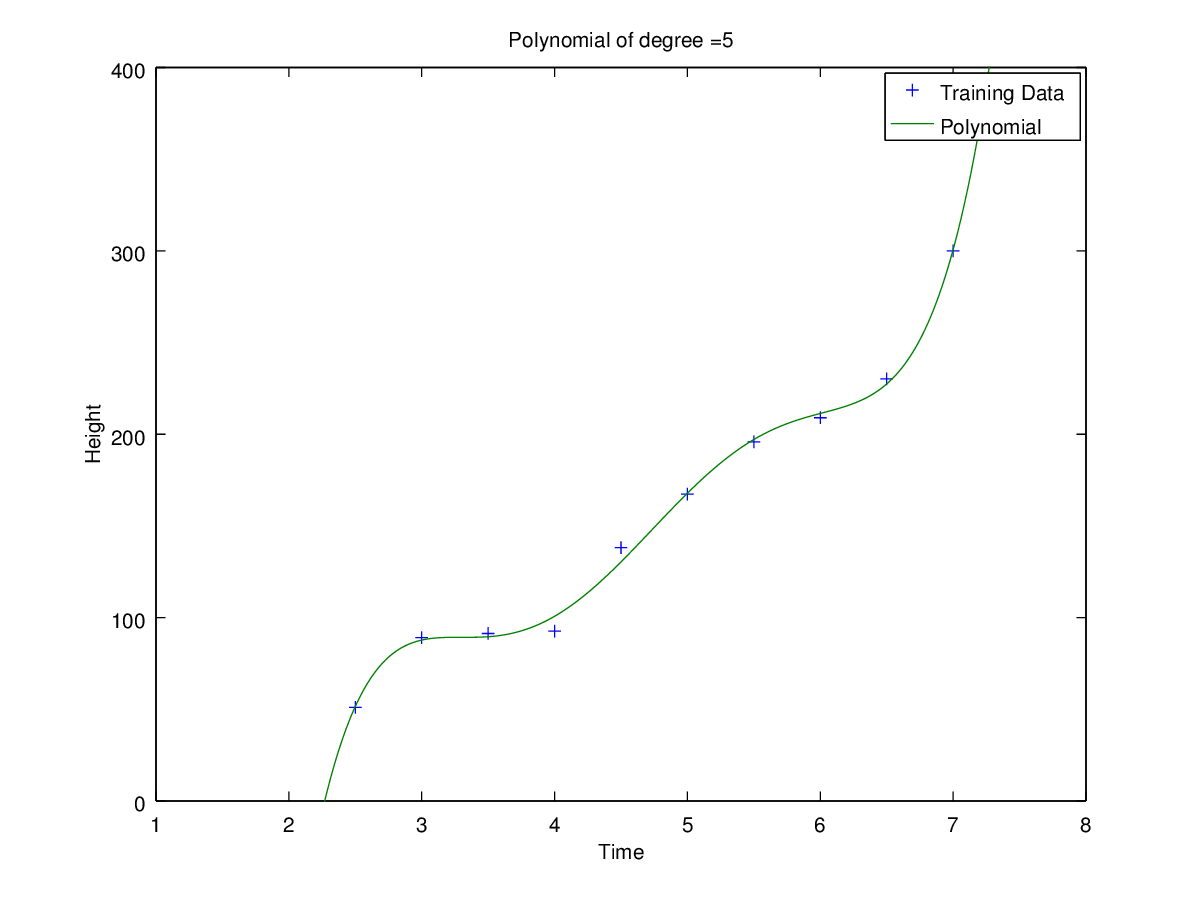
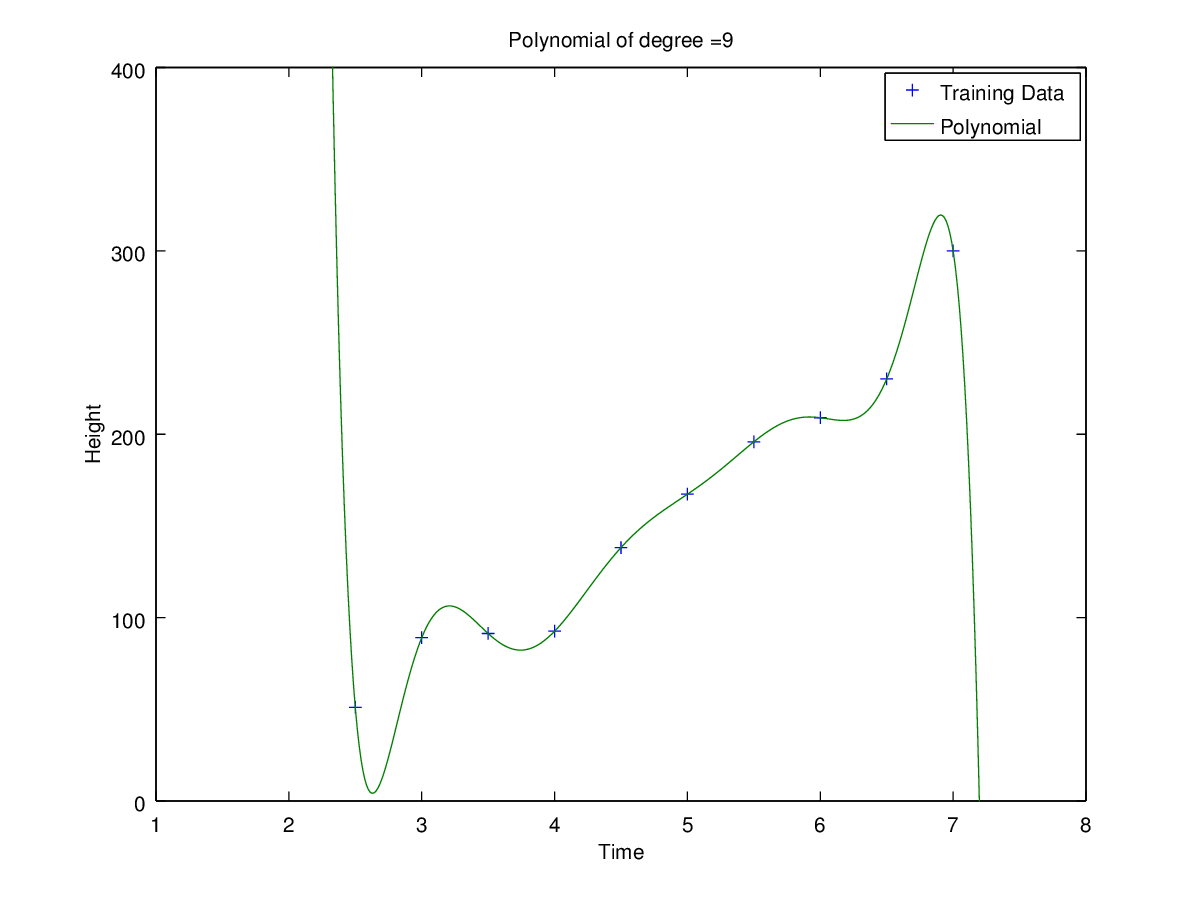
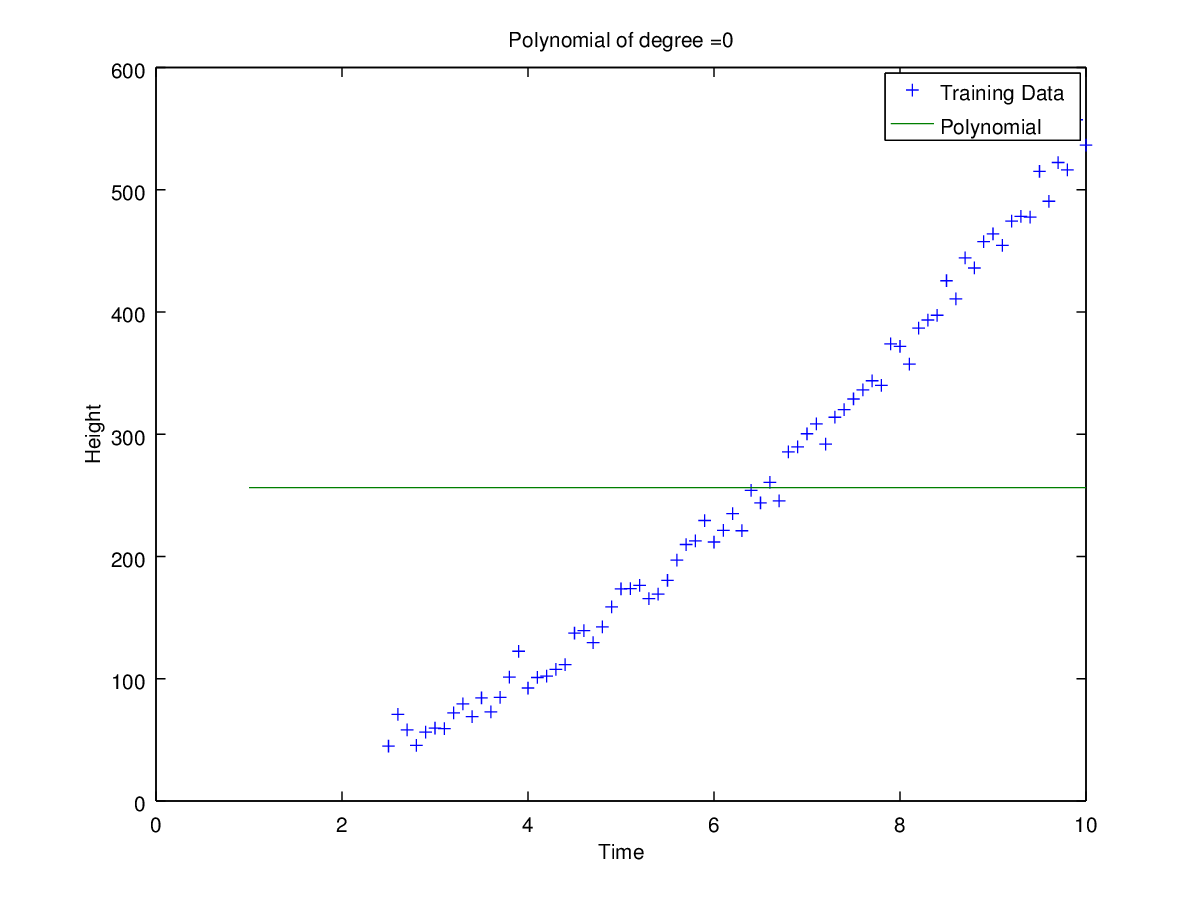
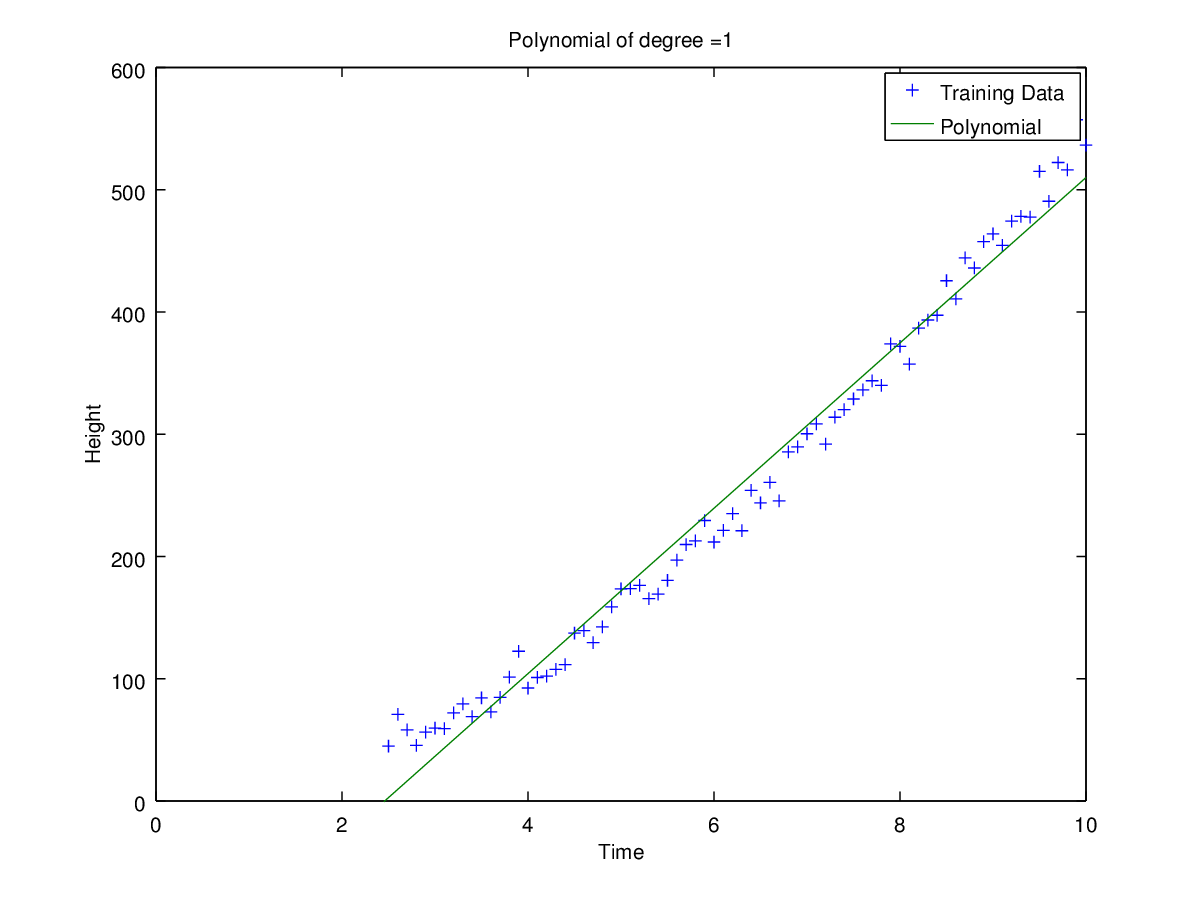
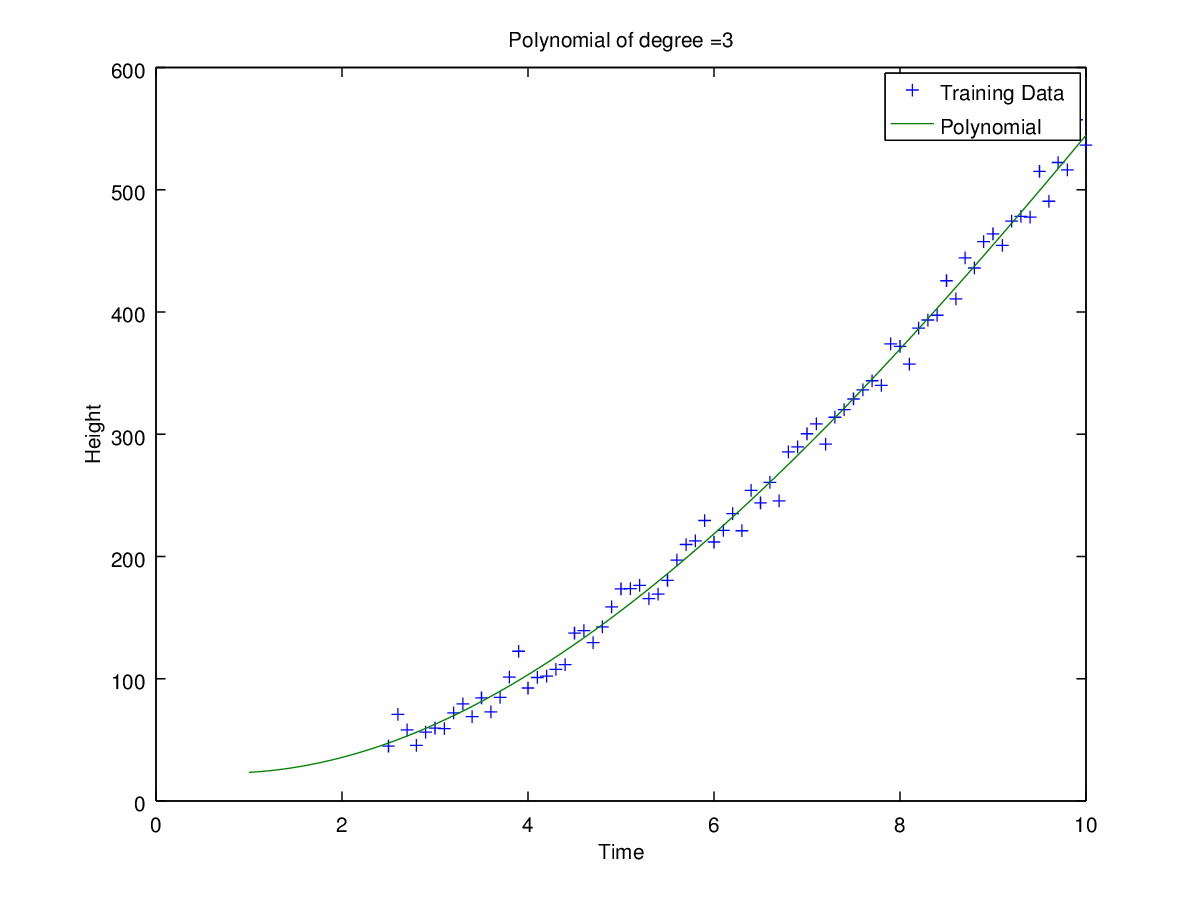
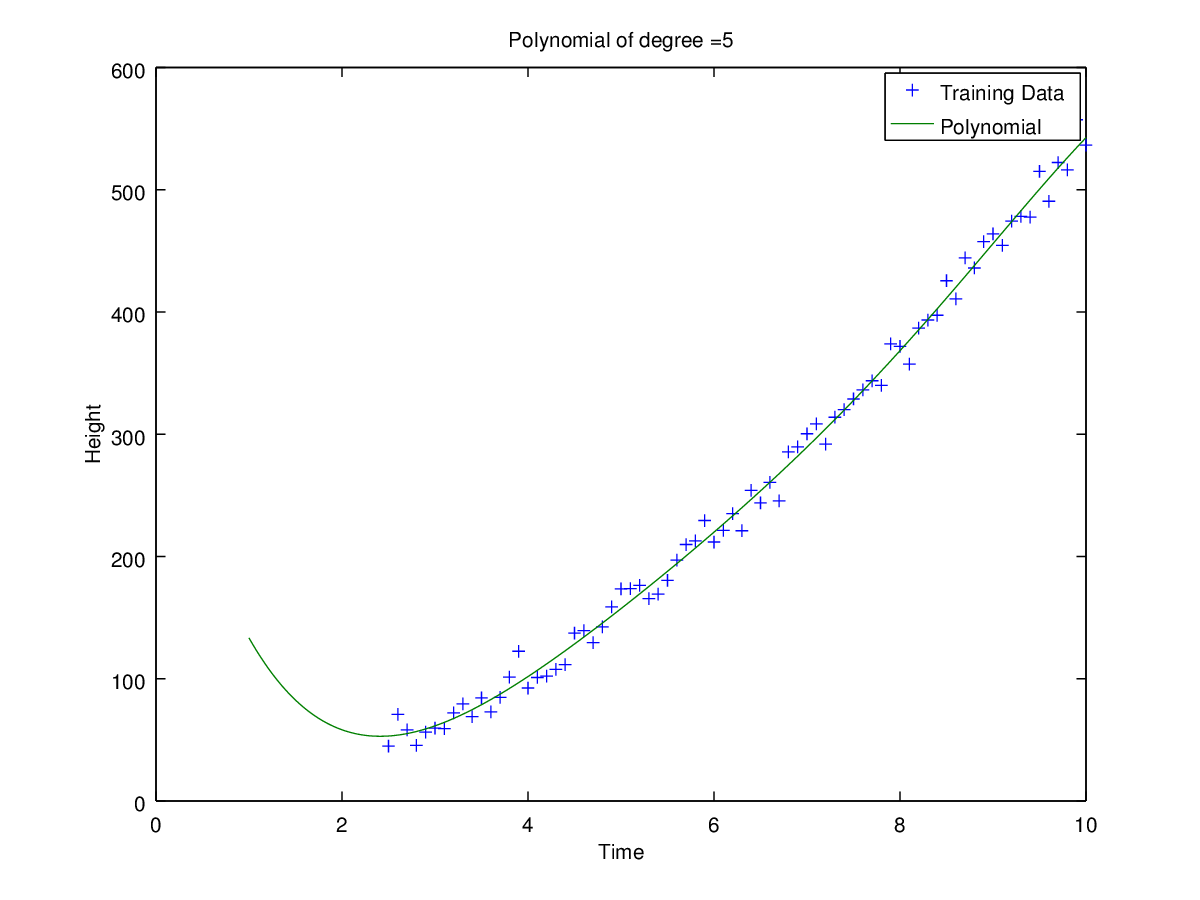
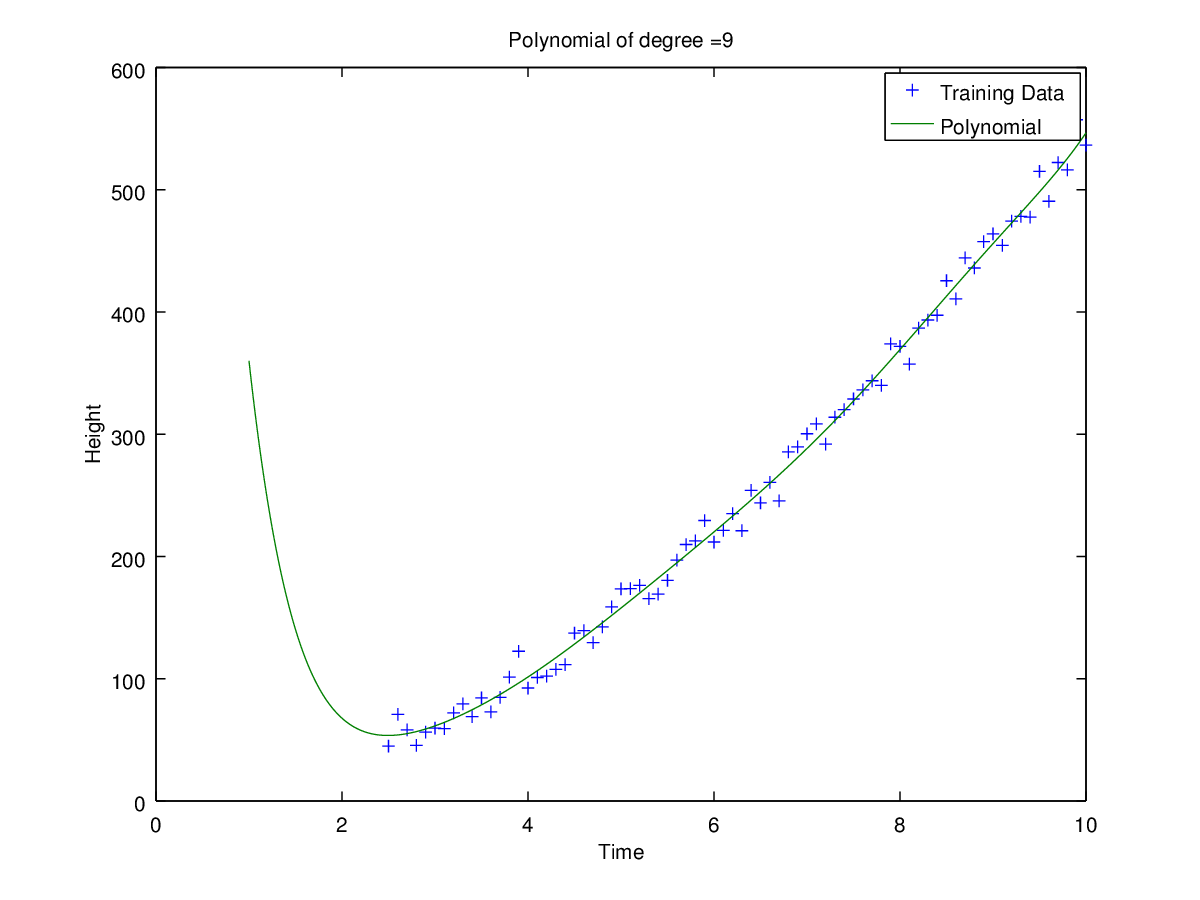
Plots of curves obtained of degrees 0, 1, 2, 3, 5 and 9
Part B: Validation
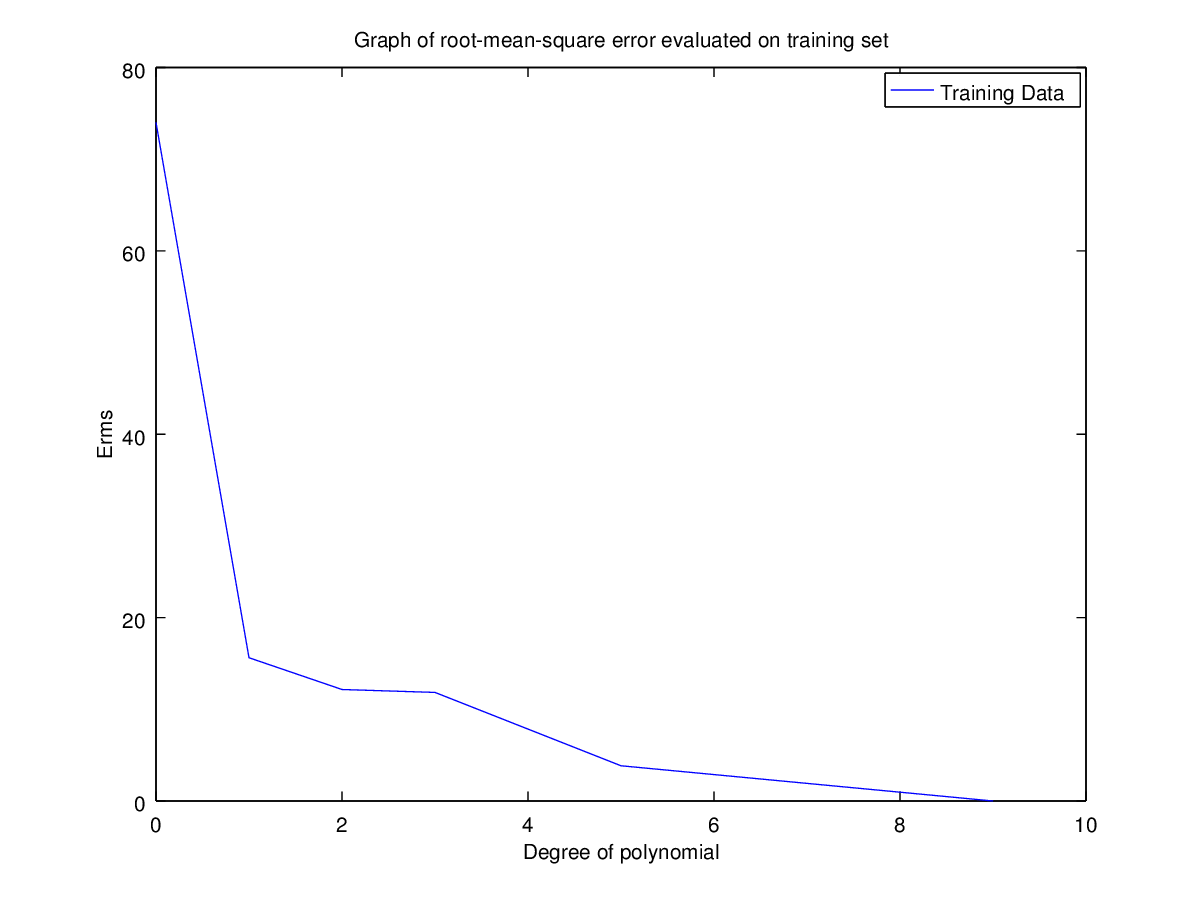
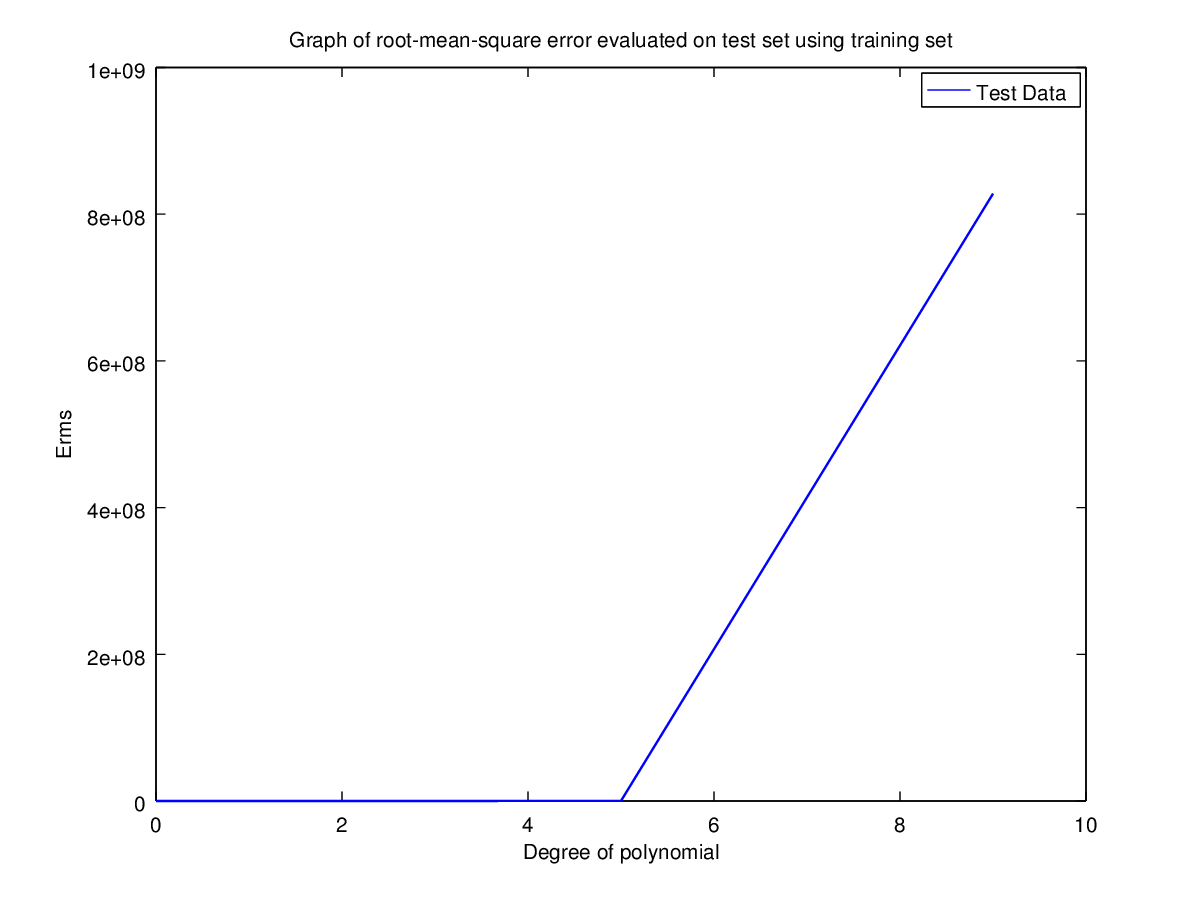
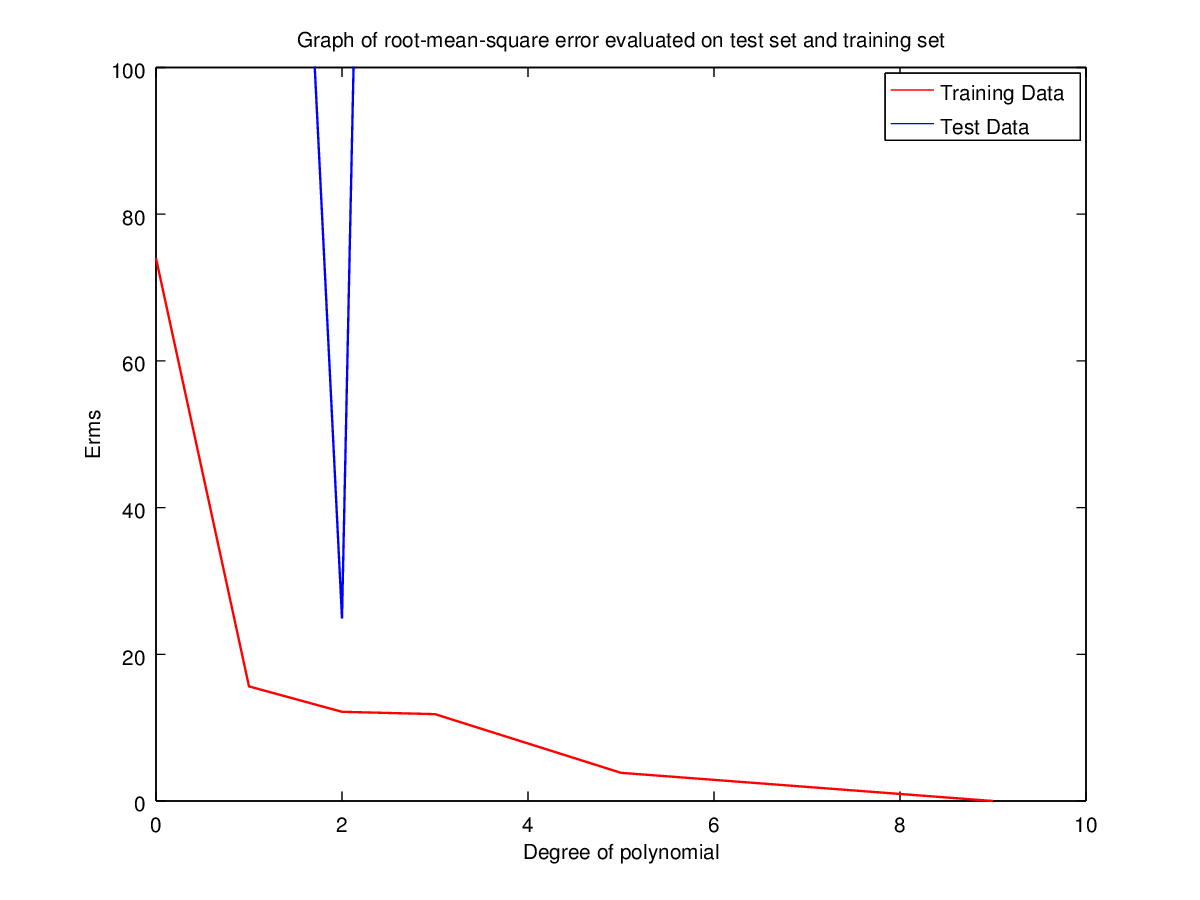
Error(Erms) Table for different data sets
Degree | 0 | 1 | 2 | 3 | 5 | 9 |
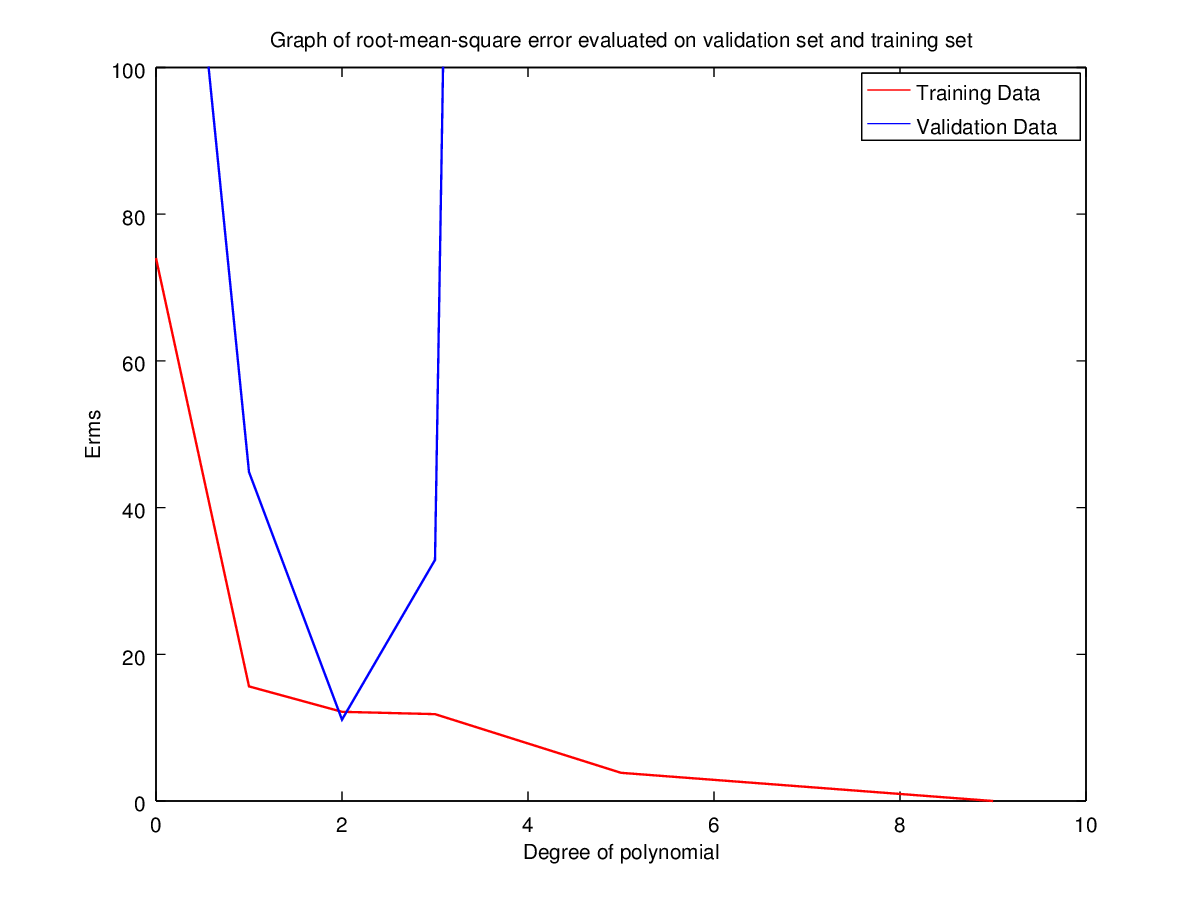
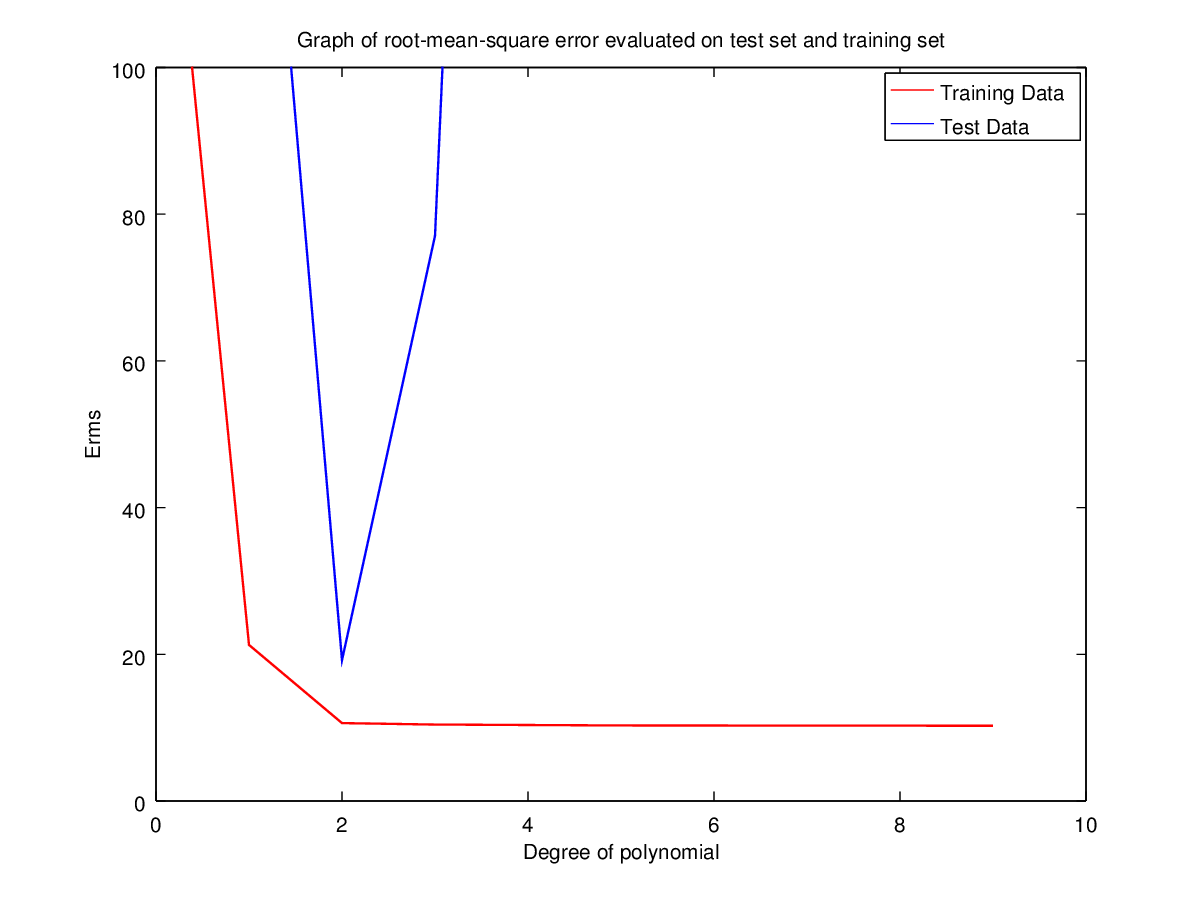
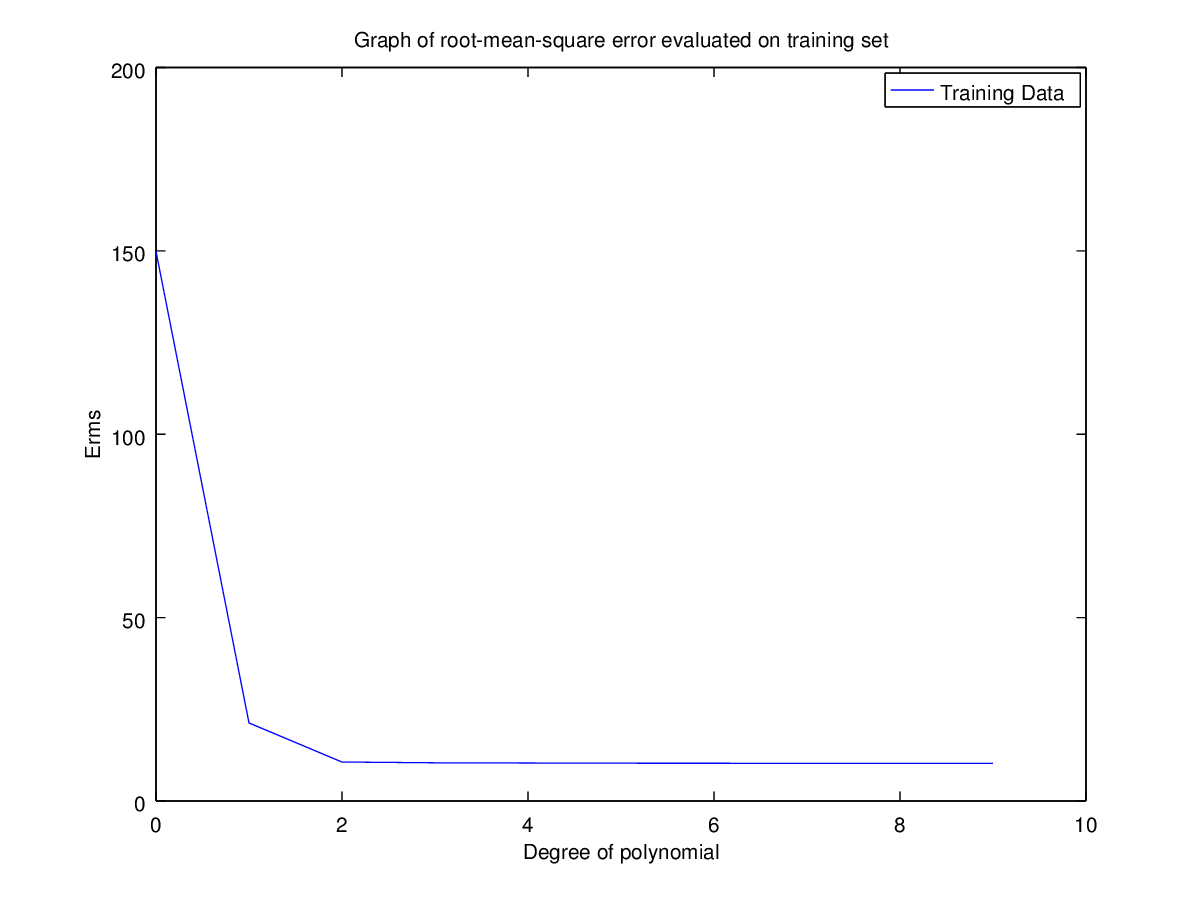
Training Set | 74.00987883822417 | 15.62451580462774 | 12.16090809108962 | 11.8421804238779 | 3.842905029648383 | 2.328903479852792e-07 |
Test Set | 629.410744713379 | 281.2525954828554 | 24.91328131435892 | 631.0638739897187 | 162838.1603881223 | 827952039.4361696 |
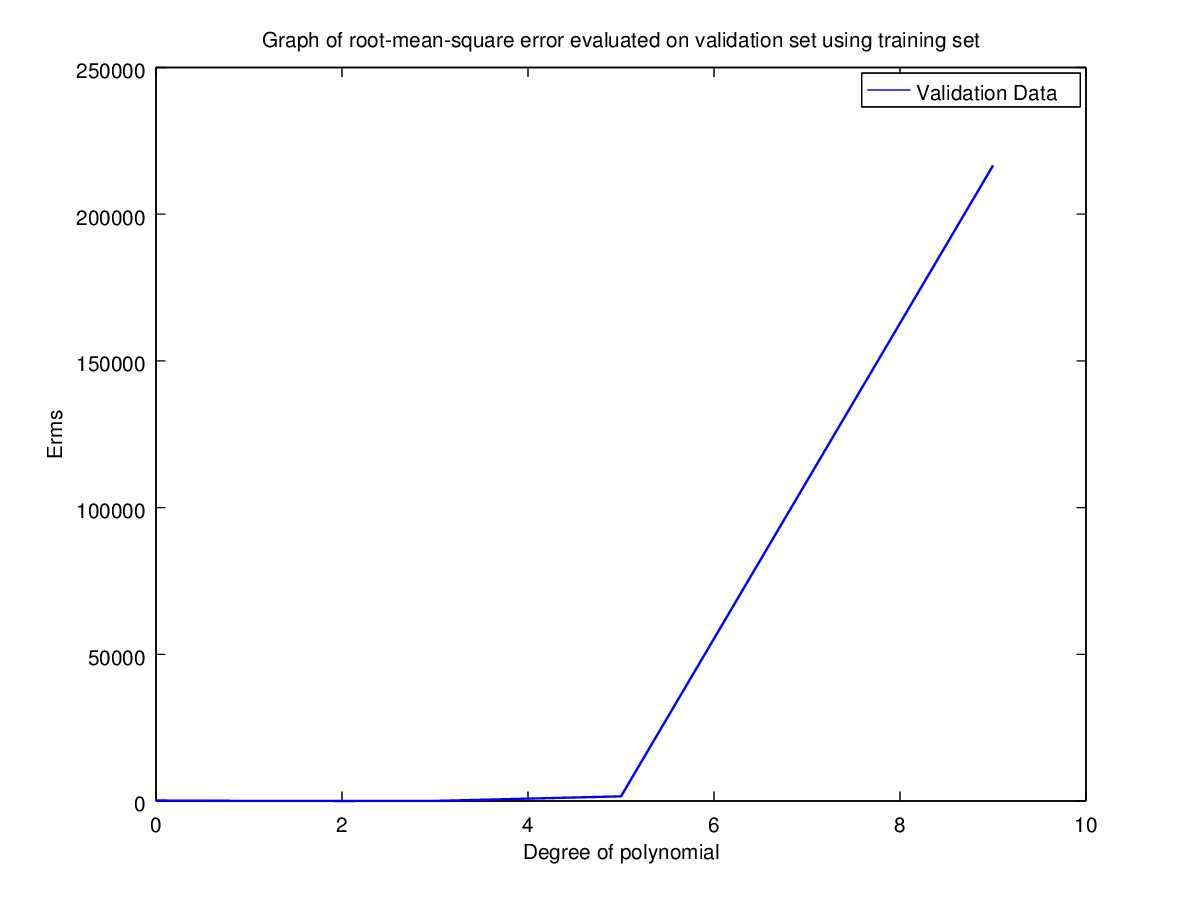
Validation Set | 171.8771193327797 | 44.85674911028034 | 11.09053468952674 | 32.8677297430707 | 1585.756131451526 | 216579.8980638061 |
Observation: Clearly for N=2 the error is minimum for validation set. Hence the optimal choice for N is 2 having root-mean-square error = 11.09053468952674.
Part C:
Coefficients for polynomial obtained using ‘h1_train_big.csv’.
Degree | 0 | 1 | 2 | 3 | 5 | 9 |
w0 | 256.3838619855513 | -166.2835748293977 | -19.49938856966844 | 27.56209951950596 | 353.0840806603857 | 2168.675007713666 |
w1 | 67.62678989039185 | 14.05591899268045 | -12.82358692326629 | -321.4112251789422 | -3575.612235002031 | |
w2 | 4.285669671816916 | 8.929589949019823 | 119.167071304206 | 2619.872467107589 | ||
w3 | -0.2476757481174882 | -18.91453318823929 | -1098.089751683805 | |||
w4 | 1.508508173295082 | 289.2515809628427 | ||||
w5 | -0.04683596924199019 | -49.14334550418263 | ||||
w6 | 5.355510632198883 | |||||
w7 | -0.3597561824547386 | |||||
w8 | 0.01348302183778243 | |||||
w9 | -0.0002141957434497342 |
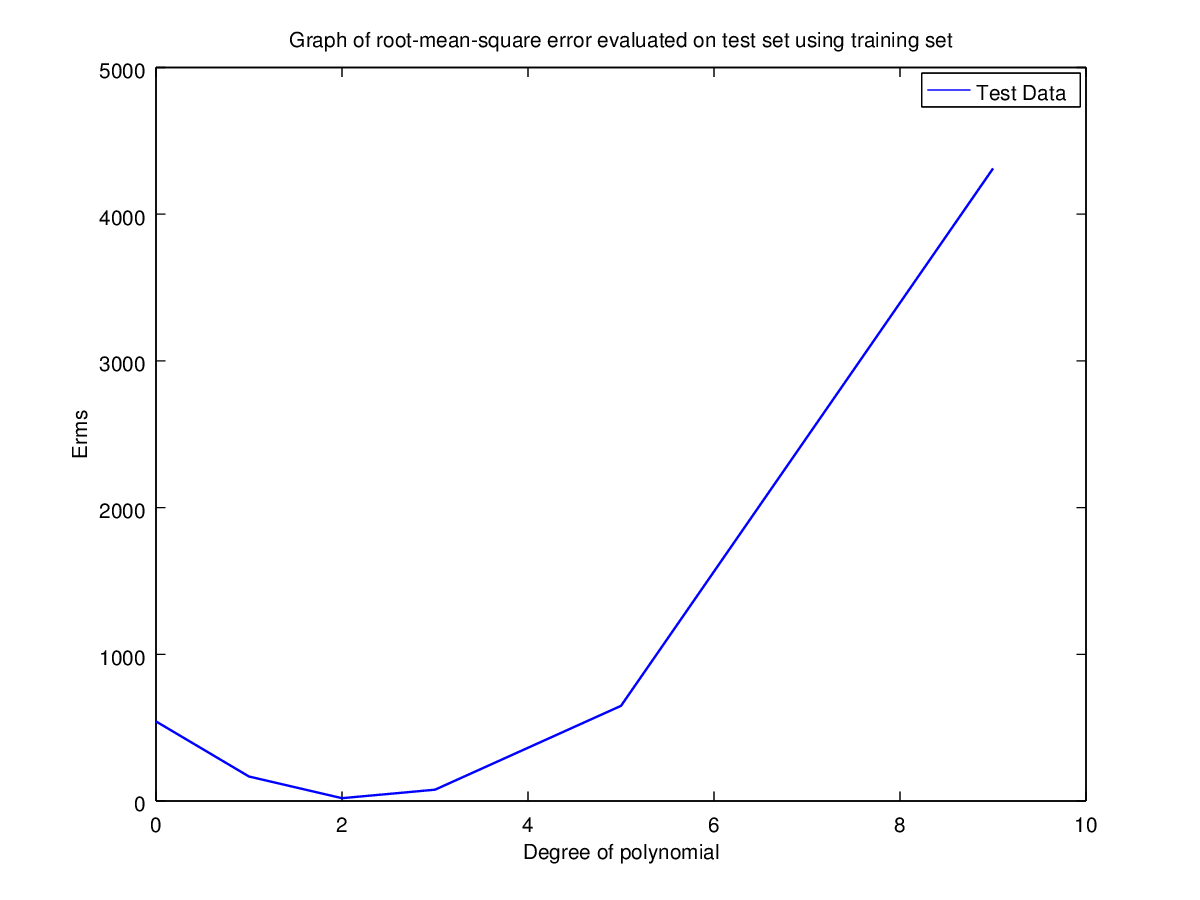
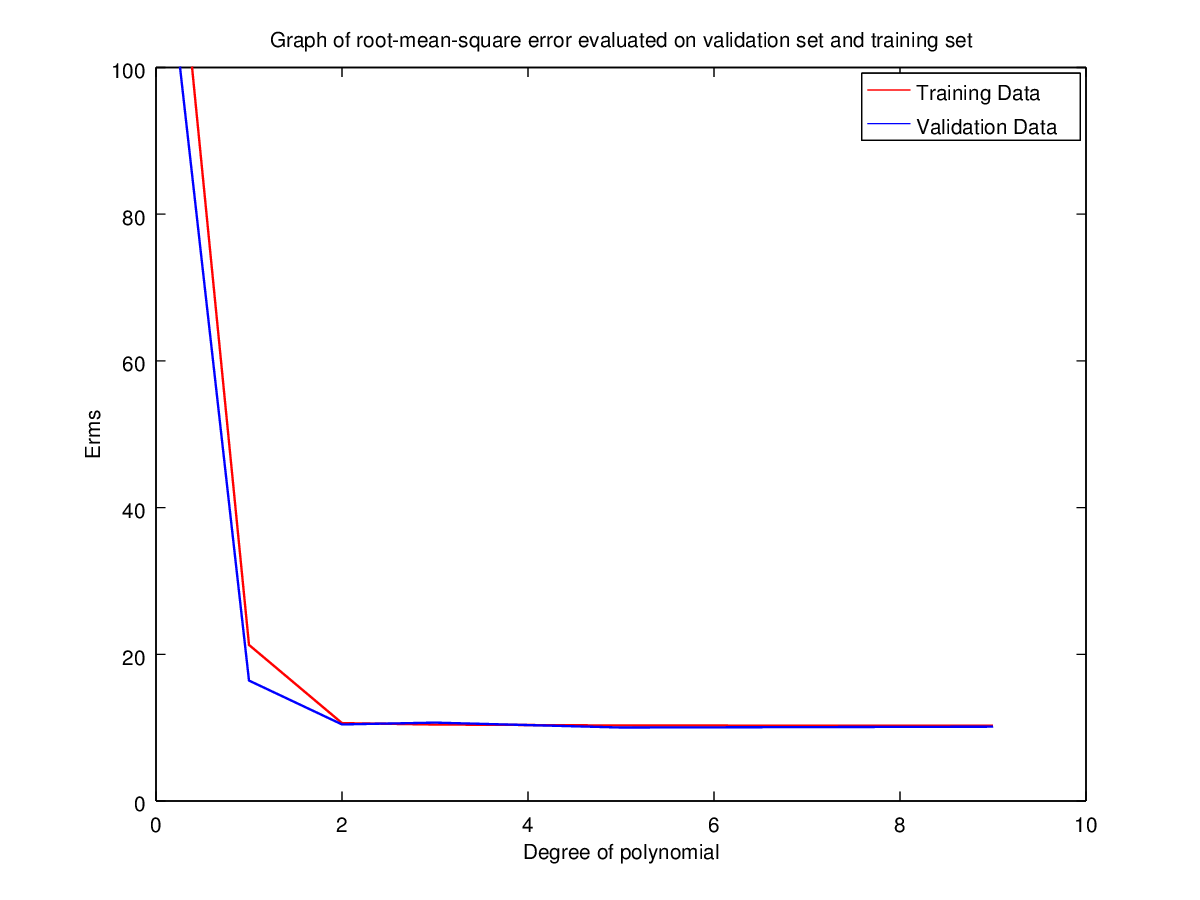
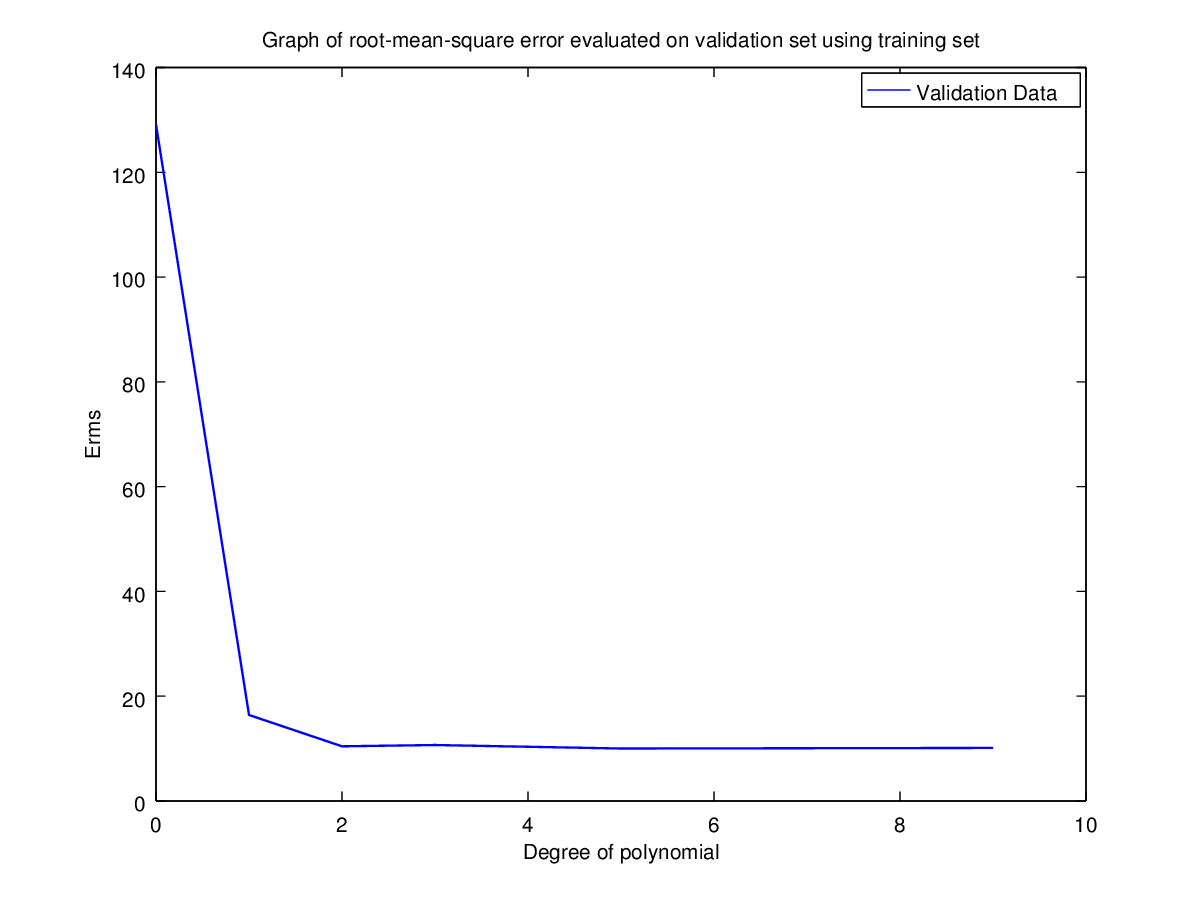
Error(Erms) Table for different data sets
Degree | 0 | 1 | 2 | 3 | 5 | 9 |
Training Set | 149.8744235246006 | 21.28235256556897 | 10.62120040139233 | 10.42105532830979 | 10.3001406393962 | 10.25676188107689 |
Test Set | 542.4778231210471 | 166.9298734733813 | 19.2005590032111 | 77.04968265996644 | 648.6526413605375 | 4311.27782863249 |
Validation Set | 129.1376272432213 | 16.41940358517186 | 10.43865816178575 | 10.68620609463883 | 10.0173140877985 | 10.13029630990042 |
Choice of N
Here the rms error is minimal for degrees 2, 3, 5, 9. If we were to select optimal N using training set only then the best choice would be 9. But using N=2 we can get approximately same result but with low complexity. Hence optimal choice for N is 2.
Using validation set also we have 5 as the best possible choice for N. But giving the same argument, N=2 appears to be the best choice. Hence, the validation set here is not much use as the error variation in both cases is very low.
Analysis
The best guess for target function will be using N=2. Which gives the function:
y = 4.285669671816916*x^2+14.05591899268045*x-19.49938856966844
The test set has larger error fluctuations as compared to the validation set. The reason for this can be attributed to the fact that the time range is approximately the same for training set and the validation set. But in case of test set, the range slightly goes out of bound for training set. Since the polynomial is not obtained using data in that range the error is high even though there were large number of data points available for training.
To download the octave scripts used in this assignment click here.