|
|
|
Effect of El-Nino Observed over Indian-Continent From Satellite Derived Ozone DataRamesh P. Singh1,Sudipta Sarkar2 and Ashbindu Singh11United Nation Environment Programme (UNEP), Global Resource Information Database (UNEP/GRID), Sioux Falls, EROS Data Center, SD 57198, USA
2Department of Civil Engineering, Indian Institute of Technology, Kanpur 208 016, INDIA(RPS ramesh@iitk.ac.in Tel. No. 91-512-597295, Fax no. 91-512-590260)
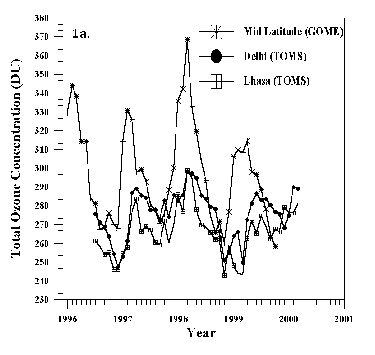
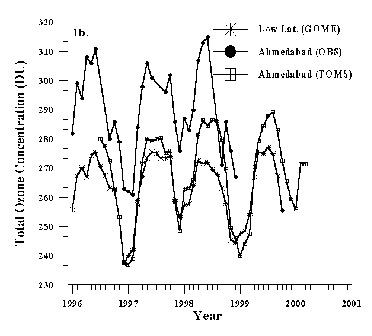
After the discovery of the ozone hole, assessment of the long-term trend of ozone in different regions of the globe has become a front line topic of earth system sciences. Trends in total ozone column (TOC) has been estimated by various authors [McPeters et al., 1996; Hollandsworth et al., 1995] using the data obtained from Dobson spectrophotometer, satellite borne instruments and balloon borne ozone sondes. Most such studies are for mid and high latitudes regions, while studies made with data from low latitude region are meager. No detailed sensor based approach has been undertaken so far to understand the total ozone scenario from an Indian perspective apart from a few observations [Chakrabarty et al., 1998] that were largely based on ground based Dobson spectrophotometer at major Indian cities. Here, we present the findings of the analysis of ozone data observed during 1996-2000 from Global Ozone Monitoring Experiment (GOME) [Burrows et al., 1999] and Earth Probe Total Ozone Mapping Spectrometer (TOMS) sensor [Herman et al., 19972]. The strong El Nino of 1997 1998 is found to influence the TOC over Indian sub-continent.Using GOME onboard ERS-2 satellite and TOMS the TOC data over Indian sub-continent have been deduced from the global data set for the period 1996-2000. The overall trend of the monthly average column ozone deduced from GOME data is found to be decreasing for the mid latitude zone 280N-420N (Fig. 1a). For the low latitude zone 60N-260N, it is more or less the same. This short data set affirms the decreasing trend reported earlier [McPeters et al., 1996]. The monthly average TOC shows high values during winter (January March) with the highest value reached around February March every year during 1996-1999. The TOC is found to decrease starting in spring and reaches a minimum value during June July of every year. The overall decreasing trend is similar to the declining trend [Hollandsworth et al., 1995; McPeters et al., 1996] found over the middle latitudes of entire northern hemisphere. This decreasing trend may be due to meridional mixing of chemically disturbed air from the Arctic polar vortex in response to cooler springs in the present decade and may also depend on water vapor variations that are forced by sea surface temperature change in the tropics. Similar time series plots for the low latitude zone (l60N-260N) show almost constant TOC value (Fig. 1b). Over the mid latitude zone, TOC for winter is found to be higher compared to summer whereas, over the low latitude zone, the TOC in summer is higher compared to winter. This agrees with earlier observations [Hollandsworth et al., 1995; McPeters et al. 1996; Chakrabarty et al., 1998] that are likely due to the change in intensity of the planetary waves from winter to summer. The monthly average TOC deduced from GOME data shows a maxima peak during March 1998, which is overall 13.7% higher than the average value for the month of March taken for four years (1996-1999). During December 1997 to June 1998, an anomalous higher value is found compared to other years (Fig. 1a) and it coincides with the warmer temperatures over Indian sub-continent. The sea surface temperature (SST) provided by the India Meteorological Department, Poona (India) over equatorial Indian Ocean was higher during the first few months of 1998. By March 1998 nearly the entire Indian Ocean had considerably warmer SST in response to the strong El-Nino effect that may also have lead to the higher TOC prominently seen over mid latitude from GOME data. Higher TOC in 1998 is found over Delhi (28.60N, 77.220E) and Lhasa (29.40N, 91.080E) in the TOMS data as well. The TOC value at these stations is found to be about 8-11% higher during 1998 compared to the monthly average TOC value taken for the month of March for the period 1996 2000. The monthly average TOC deduced from GOME data for the low latitude zone show a small value during 1998; however, the TOC deduced from TOMS data and ground observation over Ahmedabad show a higher value in 1998 (Fig. 1b). This further supports the influence of El Nino on ozone concentration (Fig. 1a). Such an effect is expected to lead to long-term global climatic change and it may have lead to the excessive rainfall in 1998 resulting in the disastrous Bangladesh and China floods have occurred.
Acknowledgements
We are grateful to Dr. Thomas Konig, DLR, Germany for providing GOME data, Dr. D.K. Chakarabarty, PRL, India for providing observed data for Ahmedabad station and IMD for providing SST over the Arabian Sea and the Bay of Bengal. The TOMS data for Ahmedabad, Delhi and Lhasa (Tibet) was downloaded from http://toms.gsfc.nasa.gov/.
|
|
|
Fig. 1.a) Total ozone concentration during 1996 2000 using GOME data for Mid latitude and TOMS data for Delhi and Lhasa. b) Low latitude deduced from GOME data, and TOMS data and ground observed data for Ahmedabad.
References
Burrows, J.P., M Weber, and M Buchwitz, The Global Ozone monitoring experiment (GOME): mission concept and first scientific results, J. Atmospheric Sci., 56, 151-175, 1999.
Chakrabarty, D.K., S.K. Peshin, K.V. Pandya, and N.C. Shah, Long-term trend of ozone column over the Indian region, J. Geophys. Res., 103, 19245-19251,1998.
Herman, J.R., P.K. Bhartia, O. Torres, C. Hsu, C. Seftor, and E. Celarier, Global distribution of UV-absorbing aerosols from Nimbus 7/TOMS data., J. Geophys. Res. 102, 16,911-16922, 1997.
Hollandsworth, S.M., R. D. McPeters, L. E. Flynn, W. Planet, A.J. Miller, Ozone trends deduced from combined Nimbus 7 SBUV and NOAA 11 SBUV/2 data., Geophys. Res. Lett. 22, 905-908, 1995.
McPeters, R.D., S.M. Hollandsworth, L.E. Flynn, J.R. Herman, and C.J Seftor, Long-term ozone trends derived from the 16-year combined Nimbus 7/Meteor 3 TOMS Version 7 record., Geophys. Res. Lett. 25, 3699-3702, 1996.