GPS Data Analysis
«» «» «» «» «» «» «» «» «» «» «» «» «» «» «» «» «» «» «» «» «» «» «» «» «» «» «» «» «» «» «» «»
GEODETIC ANALYSIS

Site (LHAS, IITK, IISC, and HYDE) direction of motion (in degrees) and velocity (mm/yr) based on one year of data (January-December 2005) in ITRF 2000 reference frame.
Based on GAMIT/GLOBK (v10.21) geodetic analysis over one year of data (January-December 2005), north offset (mm/yr) is lower in north (near Himalaya) and increases towards southern India (IITK 21.15±1.5; HYDE 24.52±1.92; IISC 25.77±2.21). East offset more in north (IITK) and decreases towards south (IITK 33.69±2.72; HYDE 28.2±2.65; IISC 19.19±3.15). Vertical component (U) shows downward movement of Indian plate (IITK -17.96±3.11; HYDE -17.28±2.97; IISC -30.21±3.38).
Rate of plate motion is higher close to Himalayan range (39.7 mm/yr) and decreases towards southern India (32 to 37 mm/yr). Resultant plate motion direction (in horizontal plane) is more towards east close to Himalayan range (57.8° at IITK; 48.9° at HYDE and 36.6° at IISC).
CHKT statistics are based on 63 days only and hence omitted from discussion since error component is very high (>± 20 mm) and long term measurement is necessary to arrive at precise figure for this site in future. Results computed in ITRF 2000 reference frame for IITK site are in agreement and consistent with those of IGS GPS permanent site (HYDE, IISC, LHAS).
We will be happy to share details on geodetic and water vapor analysis. For queries, analysis of GPS network, use of above results, GPS data, please send a mail to "ramesh@iitk.ac.in".
«» «» «» «» «» «» «» «» «» «» «» «» «» «» «» «» «» «» «» «» «» «» «» «» «» «» «» «» «» «» «» «»
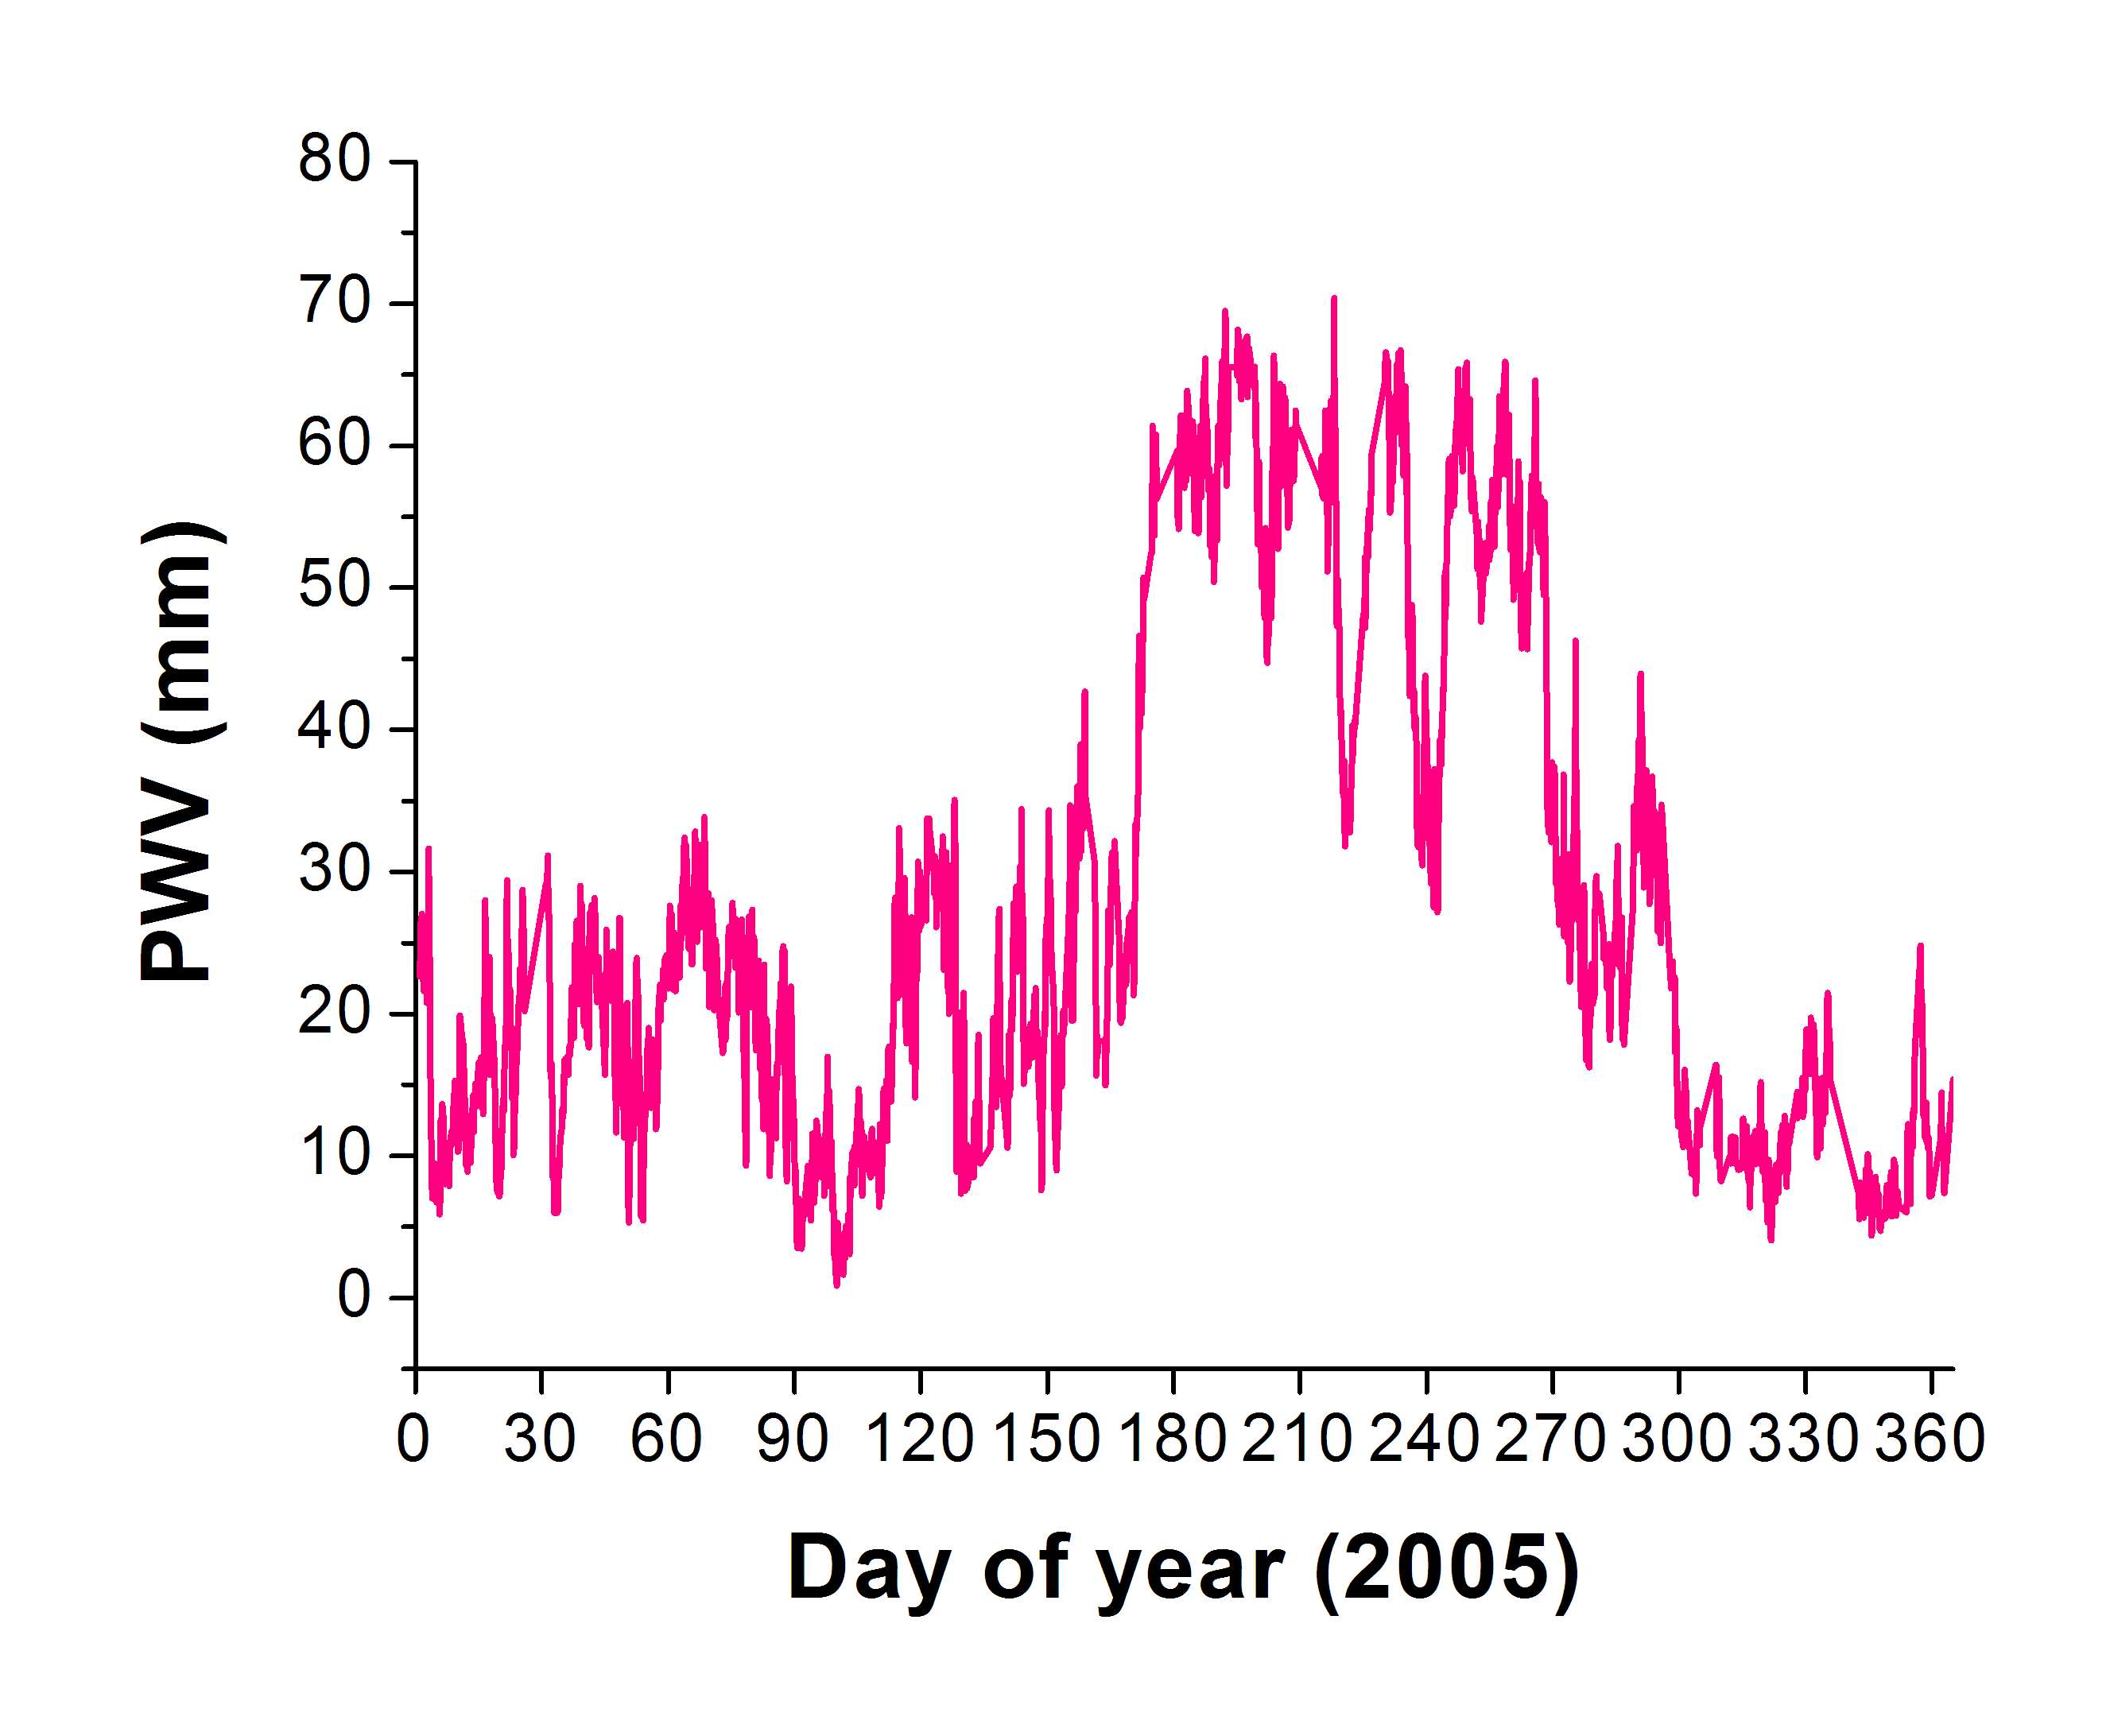
GPS Precipitable Water vapor (in mm)
IIT Kanpur site
«» «» «» «» «» «» «» «» «» «» «» «» «» «» «» «» «» «» «» «» «» «» «» «» «» «» «» «» «» «» «» «»