Publication on Gujarat Earthquake
1. R. P. Singh, S. Bhoi and
A. K. Sahoo
Significant
changes in the ocean parameters after the Gujarat earthquake
Current
Science, v. 80, no. 11, p. 1376-1377, 2001.
2. R. P. Singh, S. Bhoi, A.
K. Sahoo, Uday Raj, S. Ravindran
Surface
manifestations after the Gujarat earthquake
Current
Science, v. 81, no. 2, p. 164-166, July 2001.
3. R. P. Singh, A. K. Sahoo,
S. Bhoi, M. Girish Kumar, C. S. Bhuiyan
Ground
Deformation of the Gujarat Earthquake of 26 January 2001
J.
of Geological Society of India, v. 58, p. 209-214, 2001.
4. R. P. Singh, Sanjeeb
Bhoi,
A. K. Sahoo
Changes
Observed on Land and Ocen after Gujarat Earthquake of January 26, 2001
using IRS Data
International
J. Remote Sensing, v. 23, no. 16, p. 3123 - 3128, 2002.
5. R.P. Singh, S.
Bhoi,
S. Dey, N. Harijan, A.K. Sahoo and R. Kanwar
Anomalous
Changes in Ocean Parameters After Gujarat Earthquake of January 26, 2001
Proceedings
Symposium International "En route to GODAE" 13-15 June 2002, Biarritz,
France, p. 369 - 370, 2002.
6. S. Dey and R.P. Singh.,
Surface Latent Heat Flux as an earthquake precursor,
Natural Hazards and Earth System Sciences, v. 3, no. 6, page 749 - 755, 2003.
7. S Dey, S. Sarkar and R.P.Singh.,
Anomalous changes in column water vapor after Gujarat earthquake
Advances in Space Research, Volume
33, Issue 3,
8. Y. Okada, S. Mukai, R.P. Singh
Changes in atmospheric aerosol parameters after Gujarat earthquake of January 26, 2001
Advances in Space Research, Volume 33,
Issue 3,
A brief description of the studies taken by this team is given below:
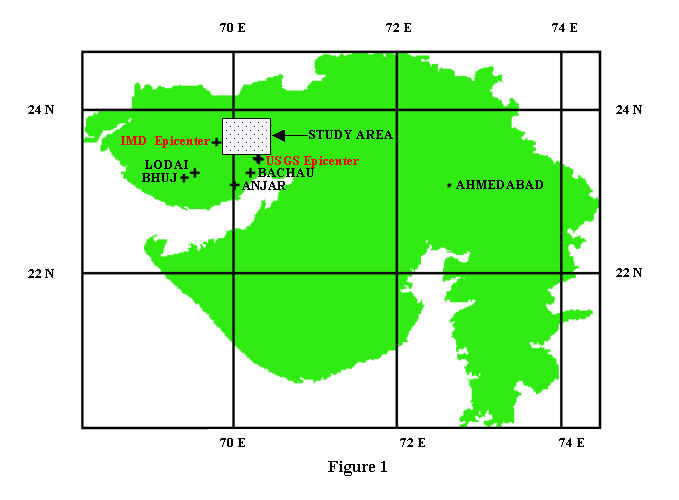
The Gujarat earthquake of January 26, 2001 generated intense shaking
which was felt by about 70 % people of India. The intense shaking
brought
out changes in the ocean and land surface and subsurface. At numerous
places,
emergence of water on the earth's surface brought hope among people
about
the future availability of drinking water in Gujarat. The preliminary
laboratory
analysis of water samples collected in the epicentral area show high
Chloride
concentration and salt content which ruled out any hope of the potable
water. Figure 2 shows the view of the earth surface near Rapar, which
shows
crater like structure, which is common in volcanic area as a result of
liquefaction. The craters are seen on the surface from where the water
has come out as a fountain up to about five feet high which was seen by
local people and the water was continued for about two hours. Near to
these
craters, long cracks up to about 50 cm wide running about 500 meter
long
with orientation East-West, North-east and South-west were seen. Near
to
these craters, pebbles (siliceous material) were also emerged in water
fountain due to pressure. Such observations conclude that this
earthquake
was associated with significant component of vertical force.
Figure -2
Dome type of structures developed due to liquefaction after the Earthquake in the nearby fields of the Rapar - Dhaurabira road (70° 36´ E, 23° 39´ N). White spots indicate the salt deposits after the expulsion of brackish water.
Multi sensors (IRS P4 OCM, MSMR and IRS 1D) and multi date remote sensing data were acquired from National Remote Sensing Agency, Hyderabad. Using the multi sensors and multi date data, various ocean and land changes have been mapped.
IRS P4 OCEANSAT Data
The IRS P4 Oceansat is the first in the series of operational ocean
remote sensing satellites, which was launched on May 26, 1999. The OCM
sensor records in 8 bands at visible and near-infrared wavelengths. The
field of view of the optics is 430, providing a swath of 1420 km from
720
km altitude. The digital data for two dates, one prior (January 18,
2001)
and after (January 26, 2001 soon after) earthquake were analysed and
chlorophyll
concentration and suspended solid were deduced. The comparison of pre
(Figures
2a and 3b) and post (Figures 2b and 3b) images shows drastic changes in
chlorophyll concentrations and suspended solids in adjoining Arabian
ocean
especially in creek region of Gujarat and also along the Western coast.
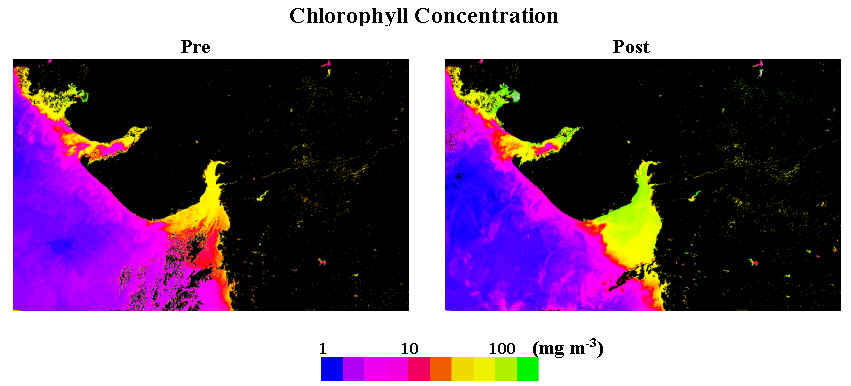
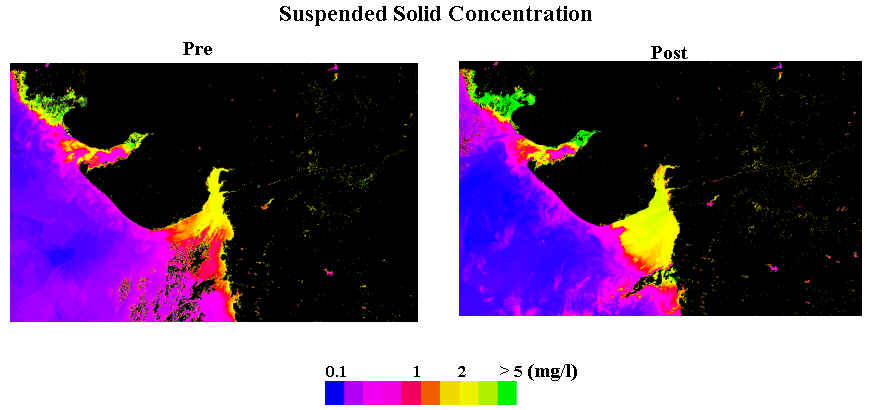
Figure 3
IRS P4 MSMR Data
IRS P4 Multi-frequency Scanning Microwave Radiometer (MSMR) data were analysed prior and after the earthquake. Significant changes in brightness temperature over land and ocean region were noticed at two frequencies 6.6 and 10 GHz in both the vertical and horizontal polarisations. At some places, increase and at some places decrease in brightness temperature have been found. The significant changes in brightness temperature are likely due to the changes in moisture level. The changes in brightness temperature is also supported from the LISS III and OCM data which also show significant changes in the moisture content.
IRS 1 D LISS-III Data
IRS 1D LISS-III pre and post data were purchased from National
Remote
Sensing Agency, Hyderabad. Surface features were extracted from these
images
and tectonic Lineaments were extracted. The post earthquake image of
January
29 shows significant surface manifestations in the epicentral area. The
comparison of Figures 4 a and 4b reveal that the moisture level has
increased
significantly due to which the paleo channel is clearly observed from
the
post image (Figure 4b). In The surface manifestations were also
observed
at the same places in the field.
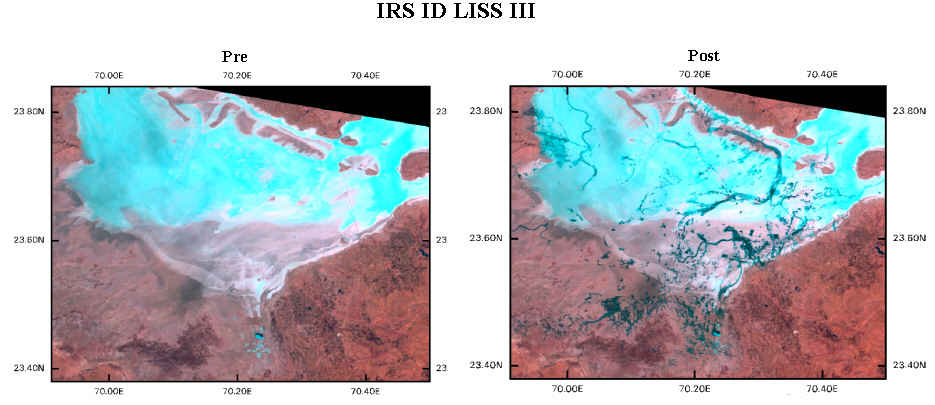
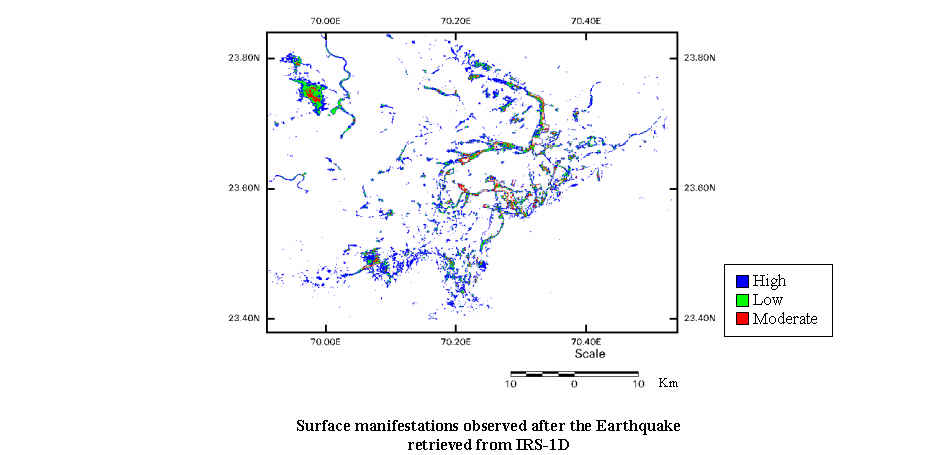
Figure 4
The detailed analysis of multi sensors and multidate data are underway. The combination of low and high resolution remote sensing data is likely to throw information related to the changes in ocean and land parameters. The integration of these information through GIS is likely to give some clues about the possible cause of this deadly earthquake and will also be useful in understanding this unique earthquake. The routine measurements of IRS P4 OCM data is needed which may give some indication of the building of the stresses inside the Earth due to upwelling of the ocean. Such routine analysis is only possible if such data are provided to the potential users freely.
Visit together with Japanese team
IIT K (Dr. R.P. Singh, Mr. Chandresh, Mr. Bhuiyan, Mr. Sanjeeb Bhoi, Mr. Harish Vishwakarma, Mr. Umesh Dwivedi) team together with three Japanese scientists (Dr. Tamao Sato - University of Hirosaki, Mr. Jim Mori - Kyoto University and Mr. Hiroaki Nigashi - National Institute for Earth Science and Disaster Prevention, Tsukuba, Japan) visited Gujarat during February 26 until March 7, 2001. During stay of 10 days following studies have been carried out. The team stayed in tent provided by Mr. B.P. Barot, Dy. SP, State Reserve Police near Bachau for few days Japanese people stayed in Sharma Resort at Gandhidham.
Aftershocks monitoring
Japanese team together with IIT K deployed eight seismometers at following sites to record aftershocks
Ground Deformation Survey
Numerous fissures and cracks were noticed by IIT K and Japanese
team.
The most prominent surface deformation as a possible secondary surface
rupture is found in North-South direction about 5 Km from Kharoi on
Kharoi
- Rapar road. The rupture is seen up to about 3 km. The surface rupture
is found to be dipping about 700 west with significant
displacement.
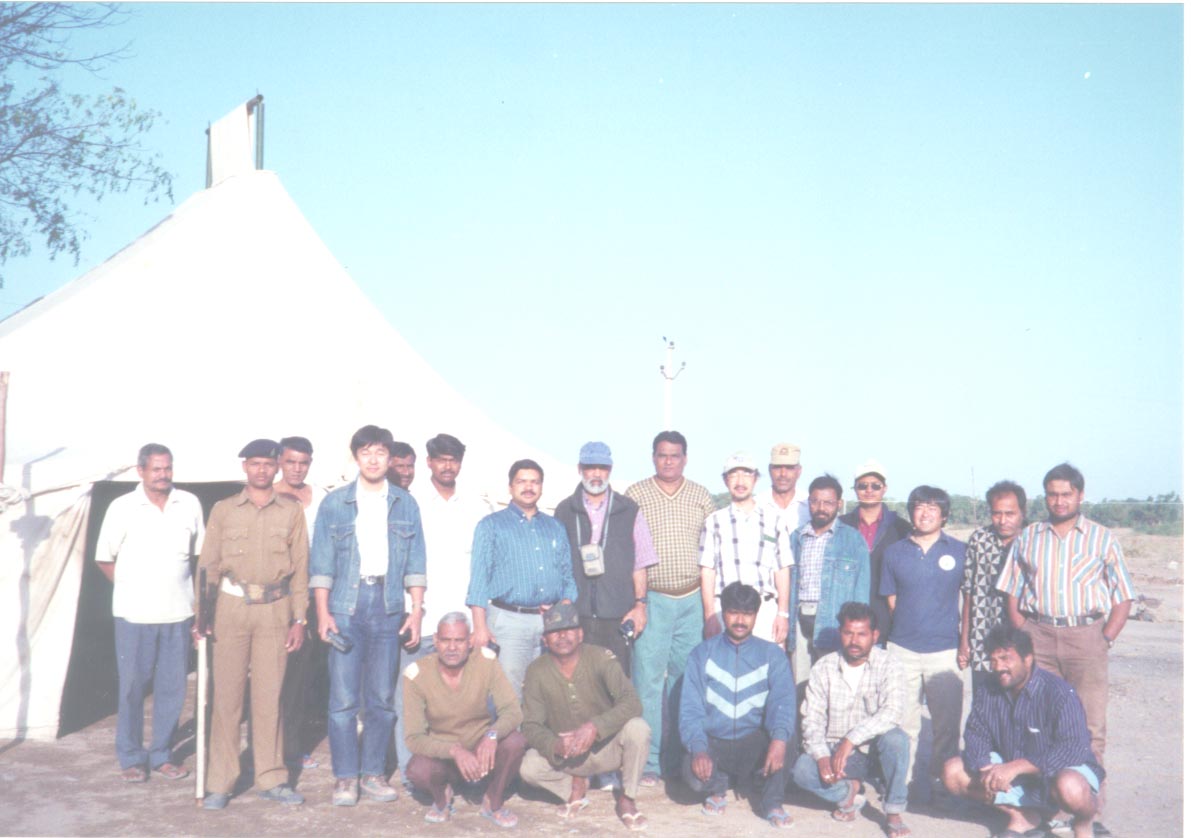
Figure 5
A group photograph of the team involved in the field survey.
Figure 6
Liquefaction zones in the nearby fields of the Rapar - Dhaurabira
road (70° 36´ E,
23° 39´ N). The trend of the cracks is N 235°
– N 55°.
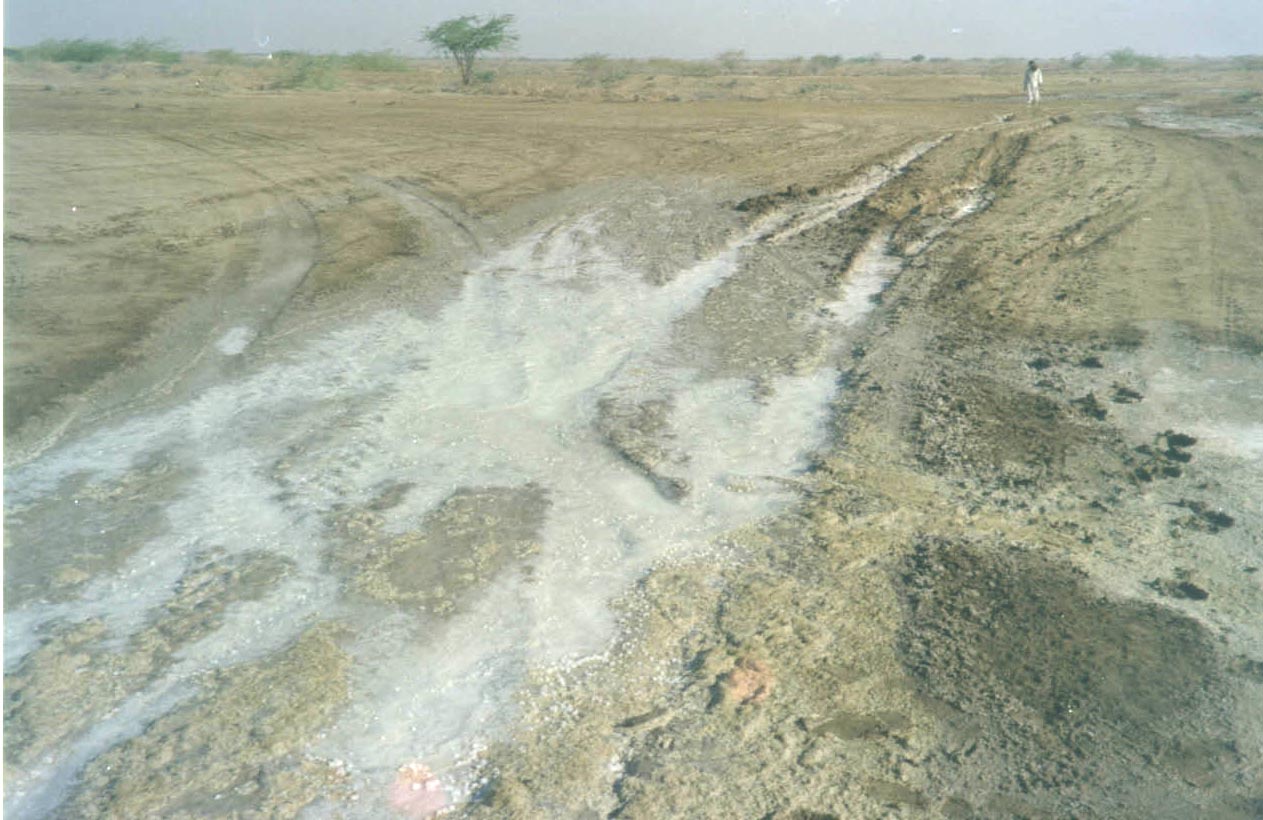
Figure 7
Extensive salt water field of around 1 sq. km emerged due to the
earthquake near Lodai village (23° 23´ N, 69°
57´ E).
Figure 8
Huge crater like openings developed near Lodai Village (69°
57´
E, 23° 23´ N). There was a lot of expulsion
of brackish water from these holes, which on drying has led to the
formation layers of salt.
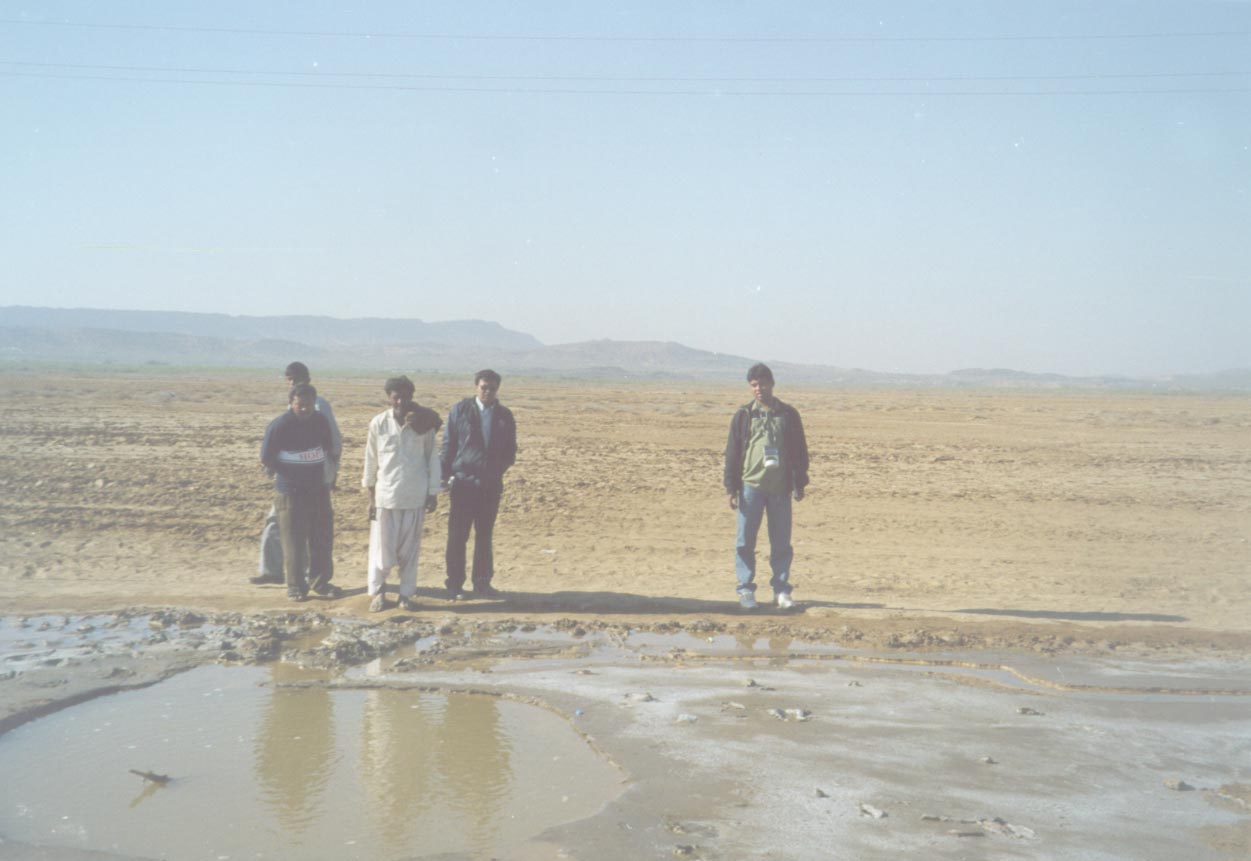
Figure 9
Small crater type of structure filled with salt water (salt water
because of liquefaction)
developed due to the earthquake near Lodai village (23°
23´ N, 69° 57´ E).
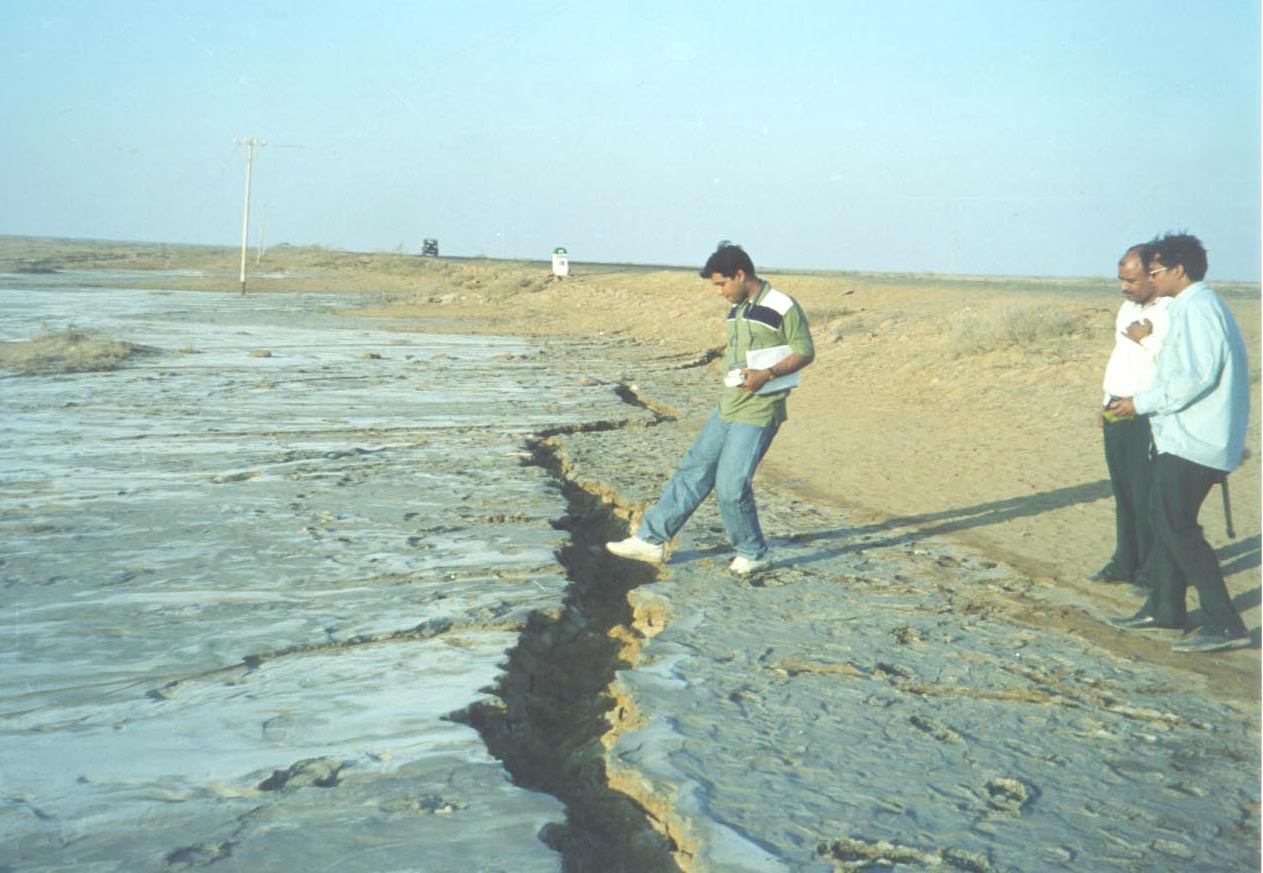
Figure 10
A big tentional crack (~ 30 cm deep) in a nearby field on
Bhuj
– Khewda
road (23° 29´ N, 69° 39´ E). Strike of
the crack is N 175° – N 355°. Salt
water has come up to the surface through the crack due to
liquefaction.
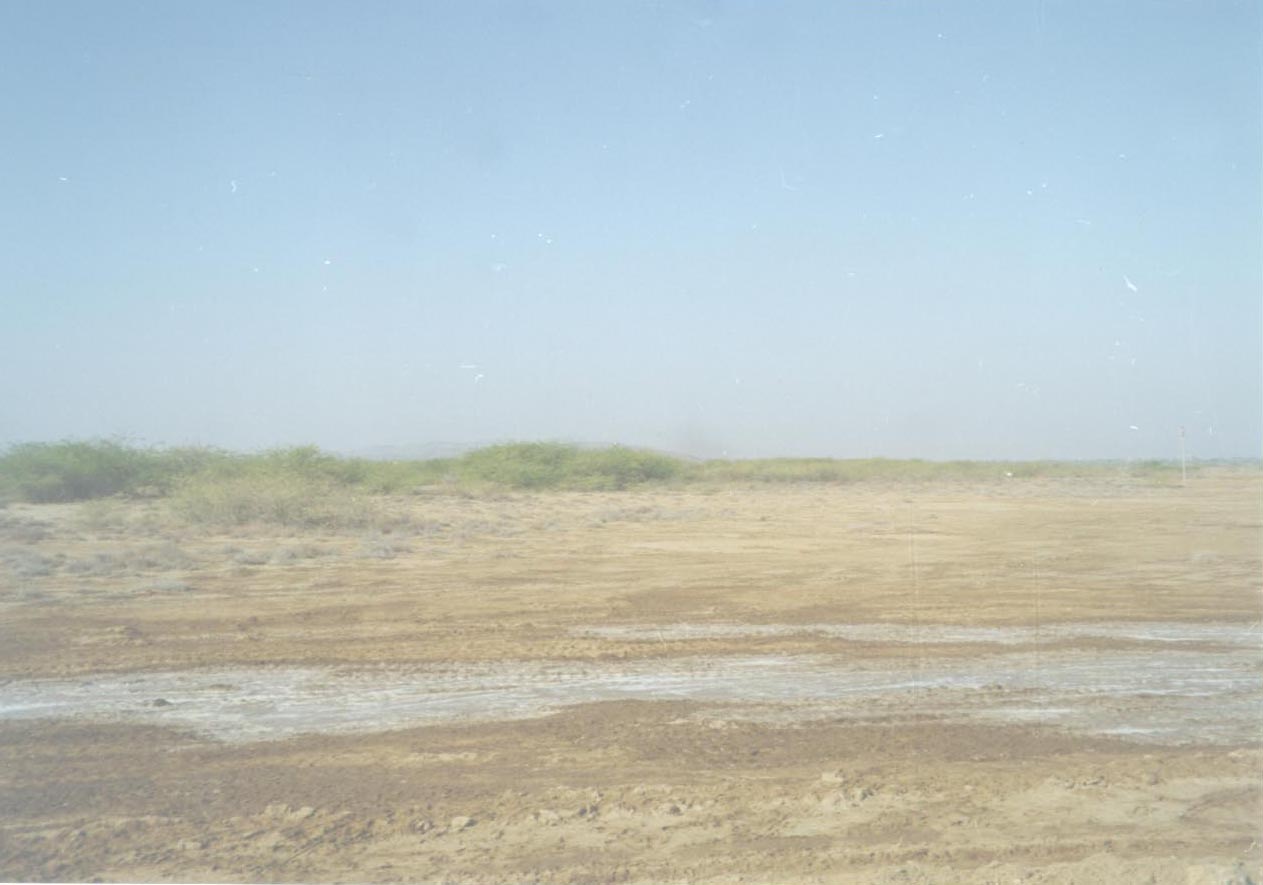
Figure 11
Extensive salt water field in a nearby field on Bhuj –
Khewda
road
(23° 29´ N, 69° 39´ E).
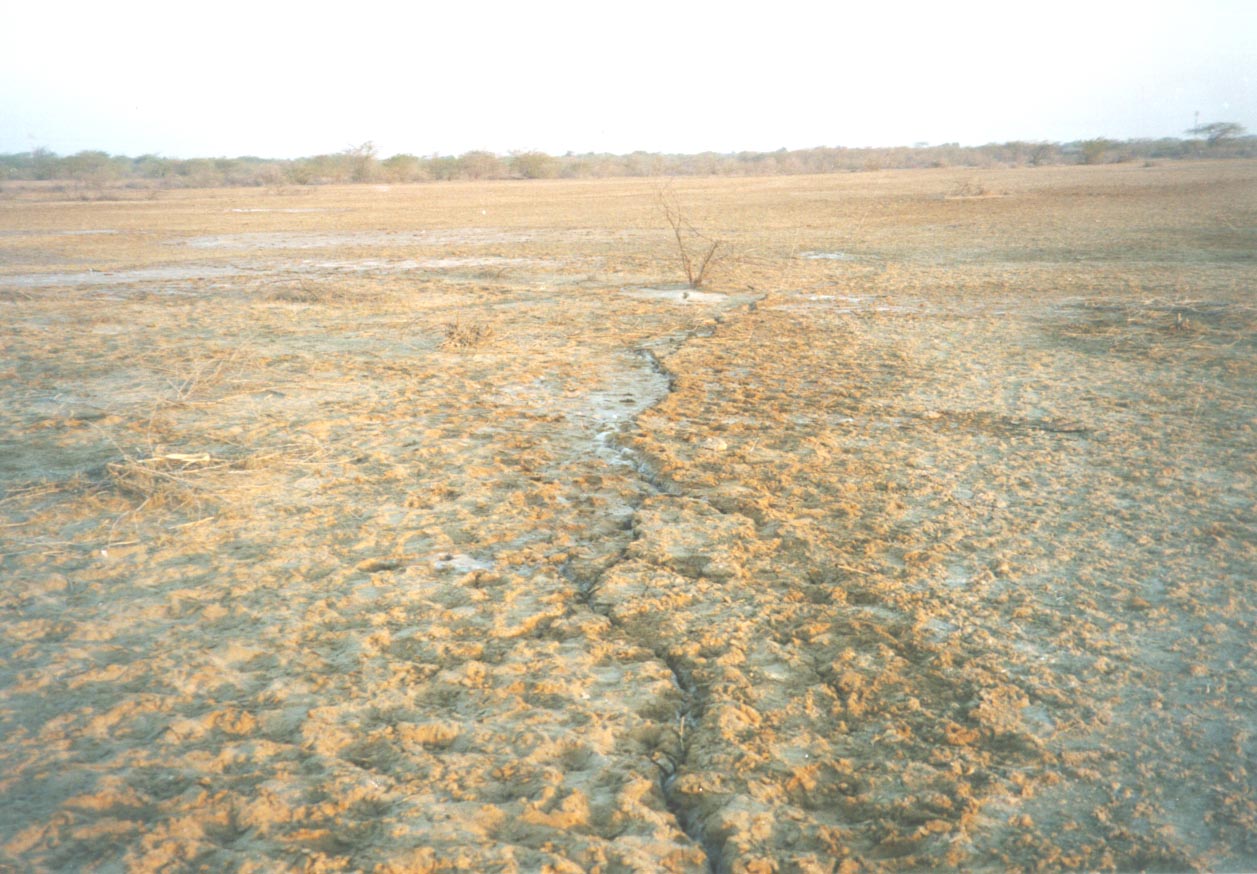
Figure 12
Compressional cracks in a nearby field on Rapar – Dhaurabira road
(23° 40´ N,
70° 36´ E). Strike of the crack is N 345° – N 165°.
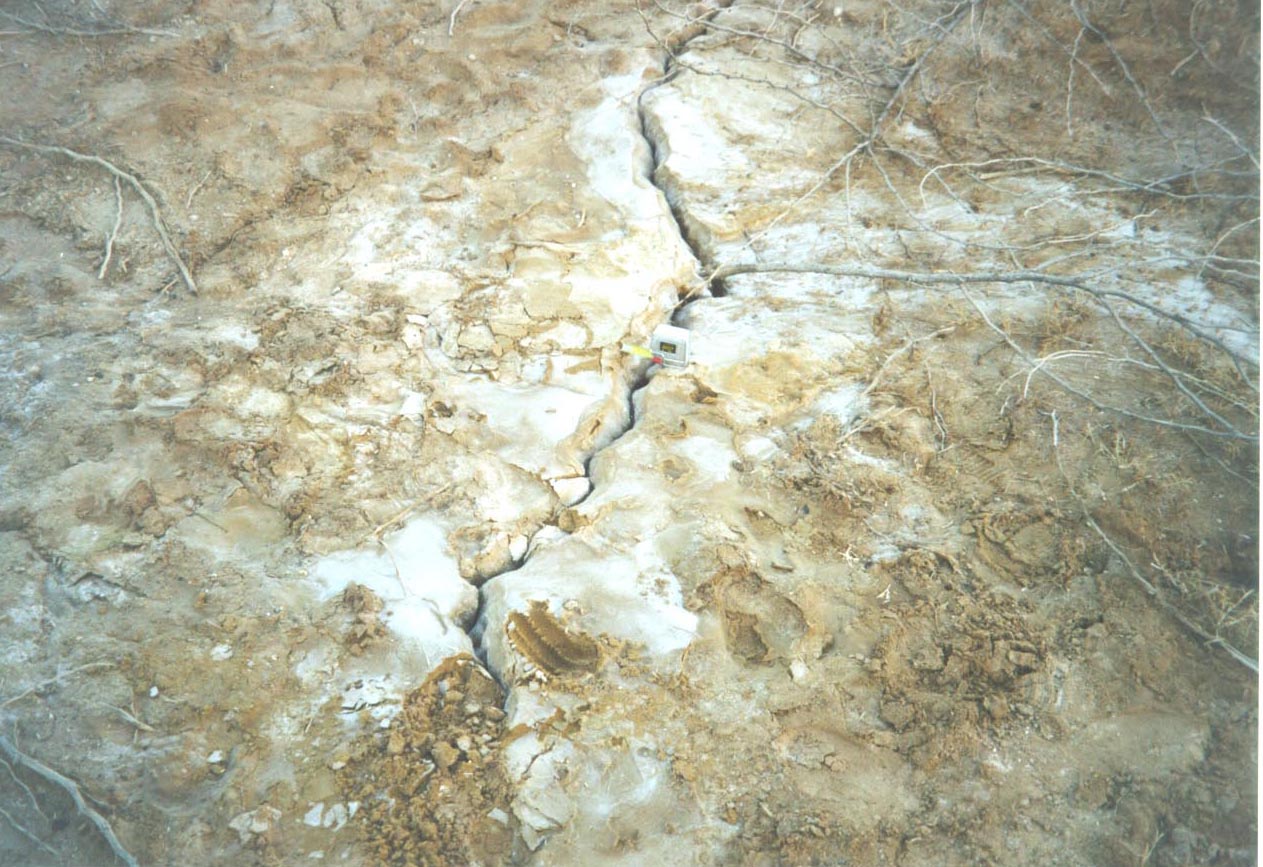
Figure 13
Small tentional cracks at the same location as the previous
photograph.
The strike
of the crack is N 60° – N 240°. Salt water on the surface
because of the liquefaction through the crack.

Figure 14
Cracks developed on the surface near Barudia
village (23° 34´ N, 70° 24´ E). Strike of the
fault is N 330° - N 150°.
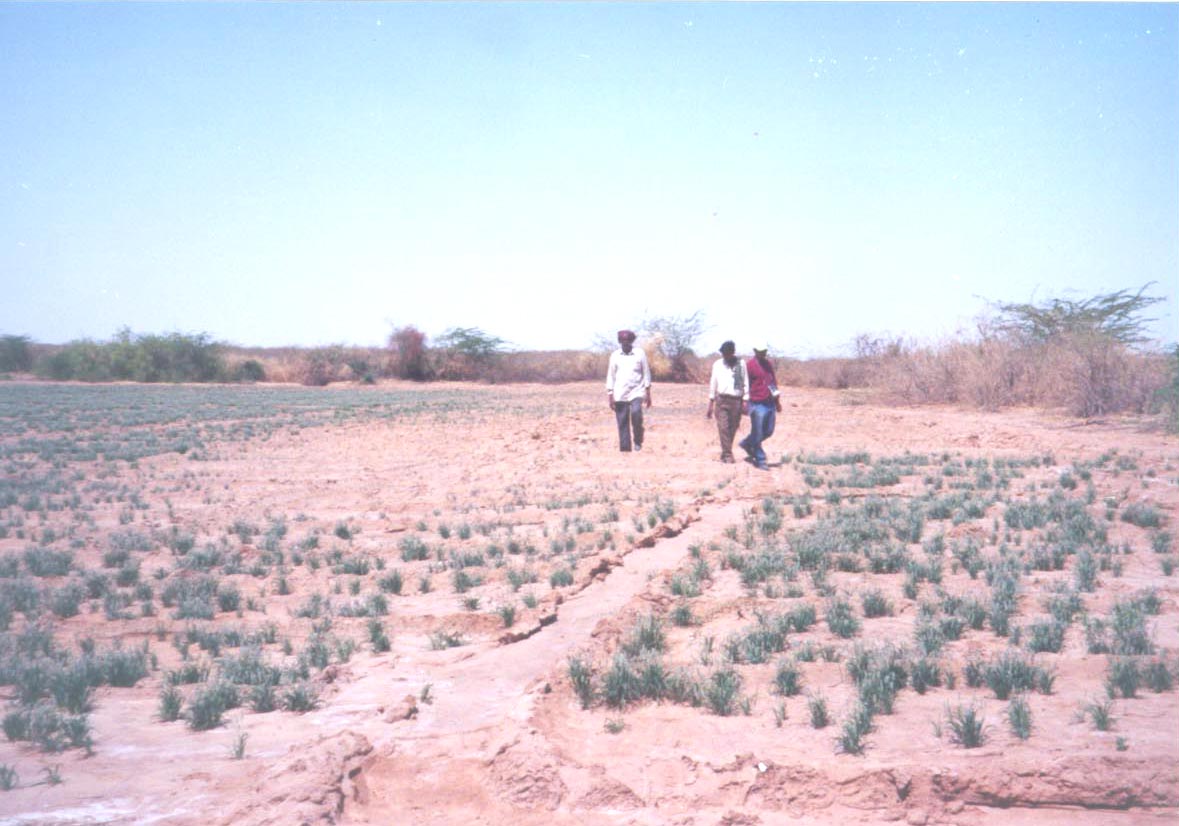
Figure 15
Cracks developed on the surface near Barudia village (23°
34´
N, 70° 25´ E). Strike of the fault is N 330° - N 150°.
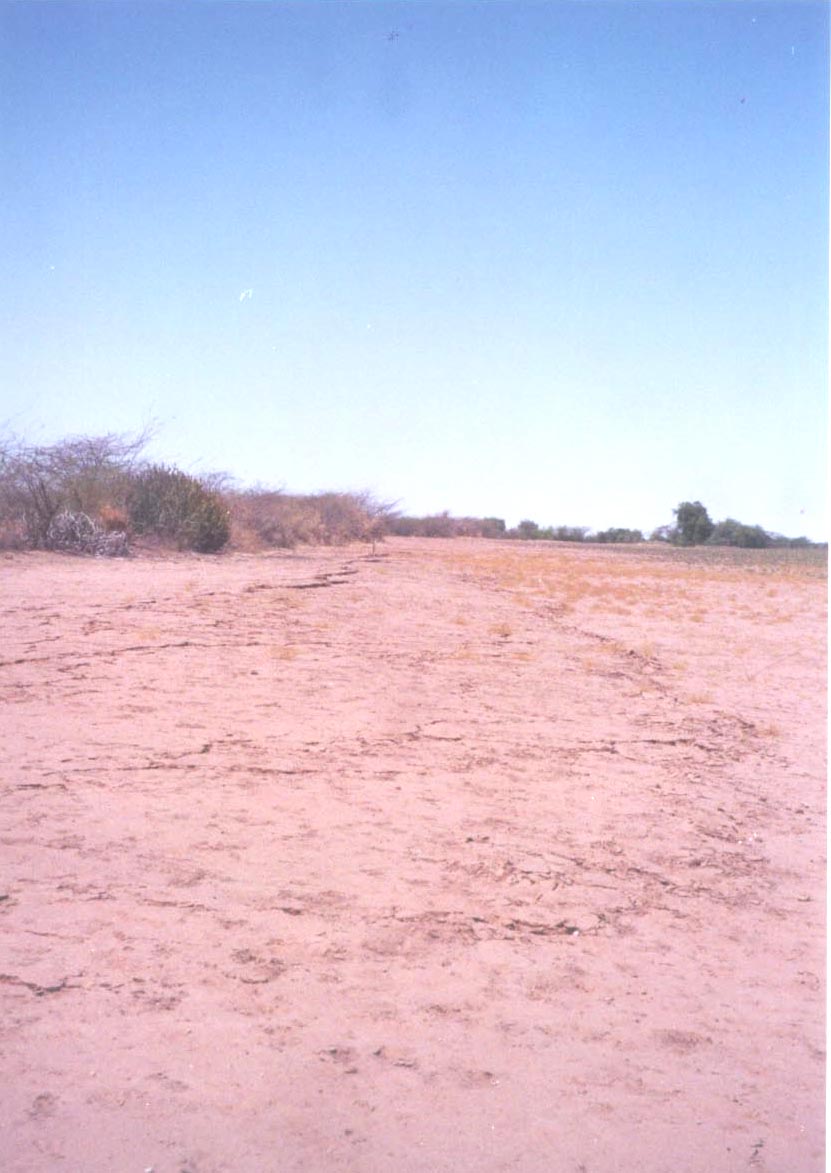
Figure 16
Cracks developed on the surface near Barudia village (23°
34´
N,
70° 24´ E). Strike of the fault is N 330° - N 150°.
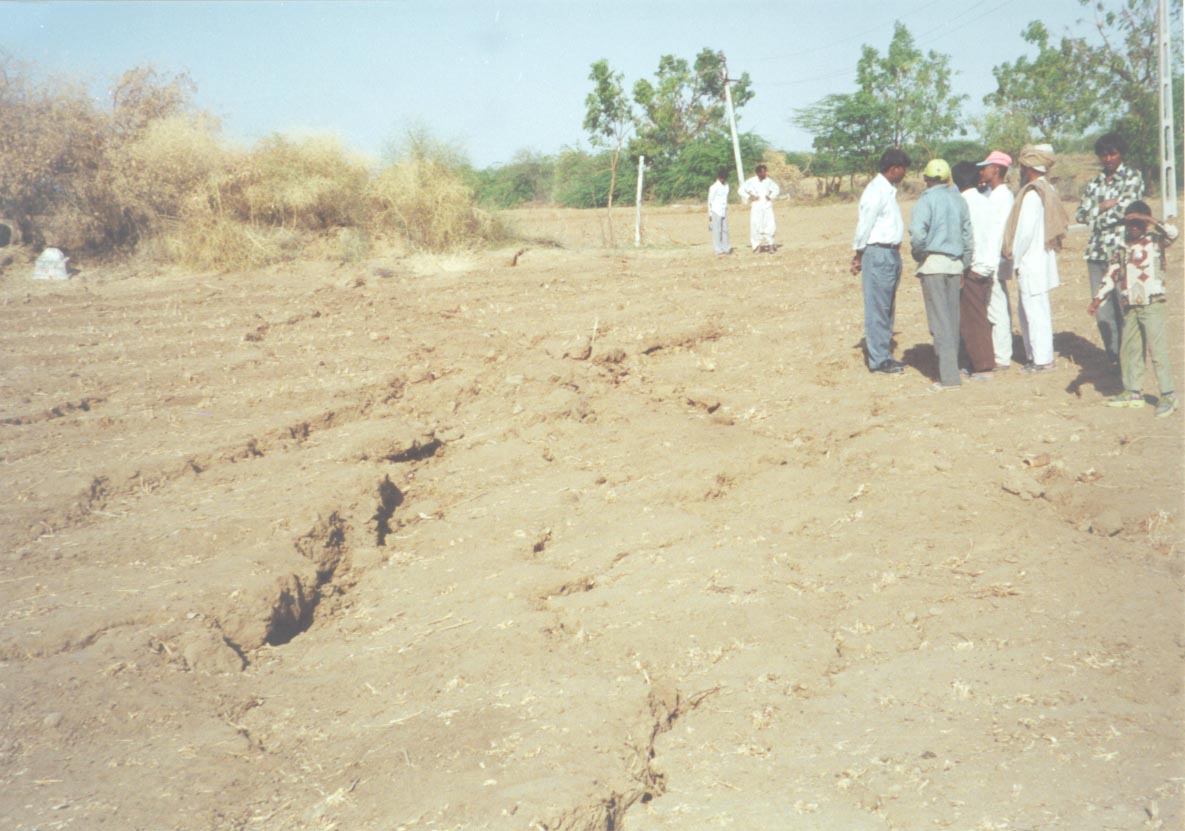
Figure 17
Cracks developed on the surface near Barudia village (23°
34´
N, 70° 24´ E). Strike of the crack is N 330° - N 150°.
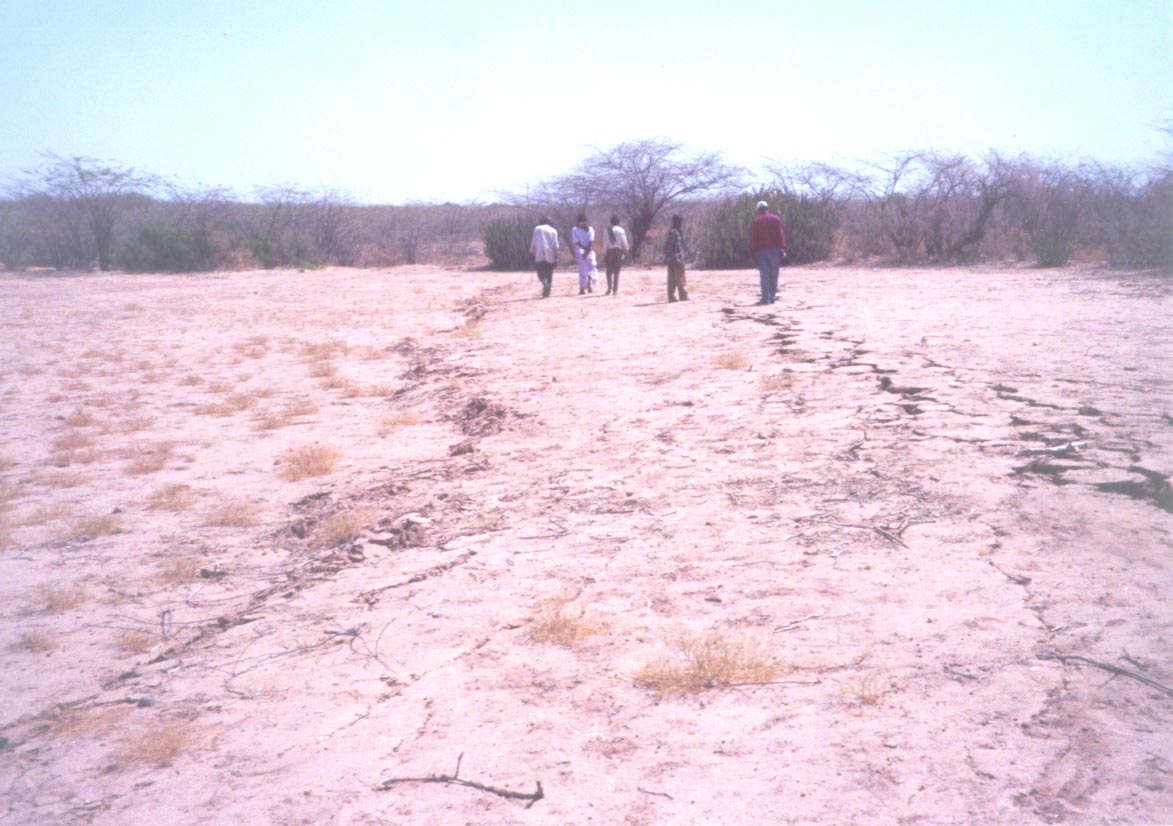
Figure 18
Surface manifestation developed near Barudia village (23°
34´
N, 70° 24´ E). Strike of the fissure is N 330° - N
150°.
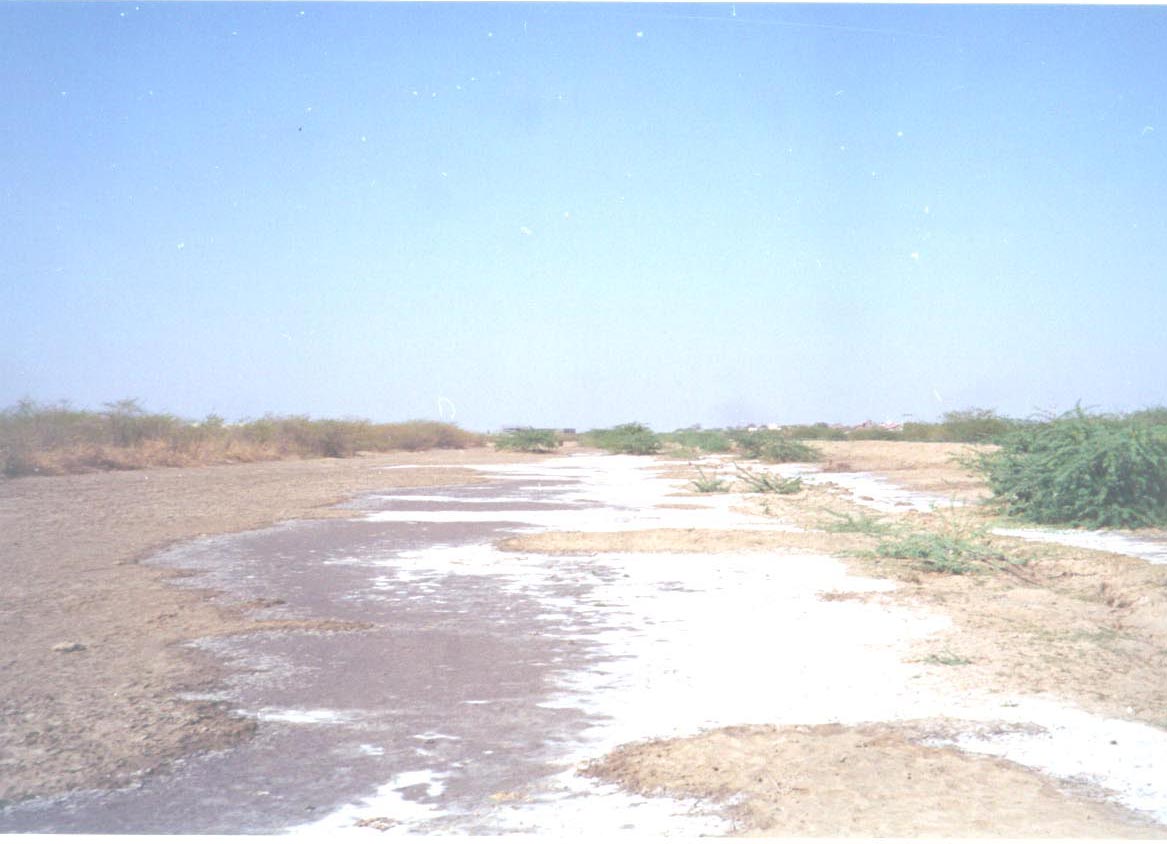
Figure 19
A layer of salt formed due to the evaporation of the brackish
water
as a result of liquefaction due to the earthquake.
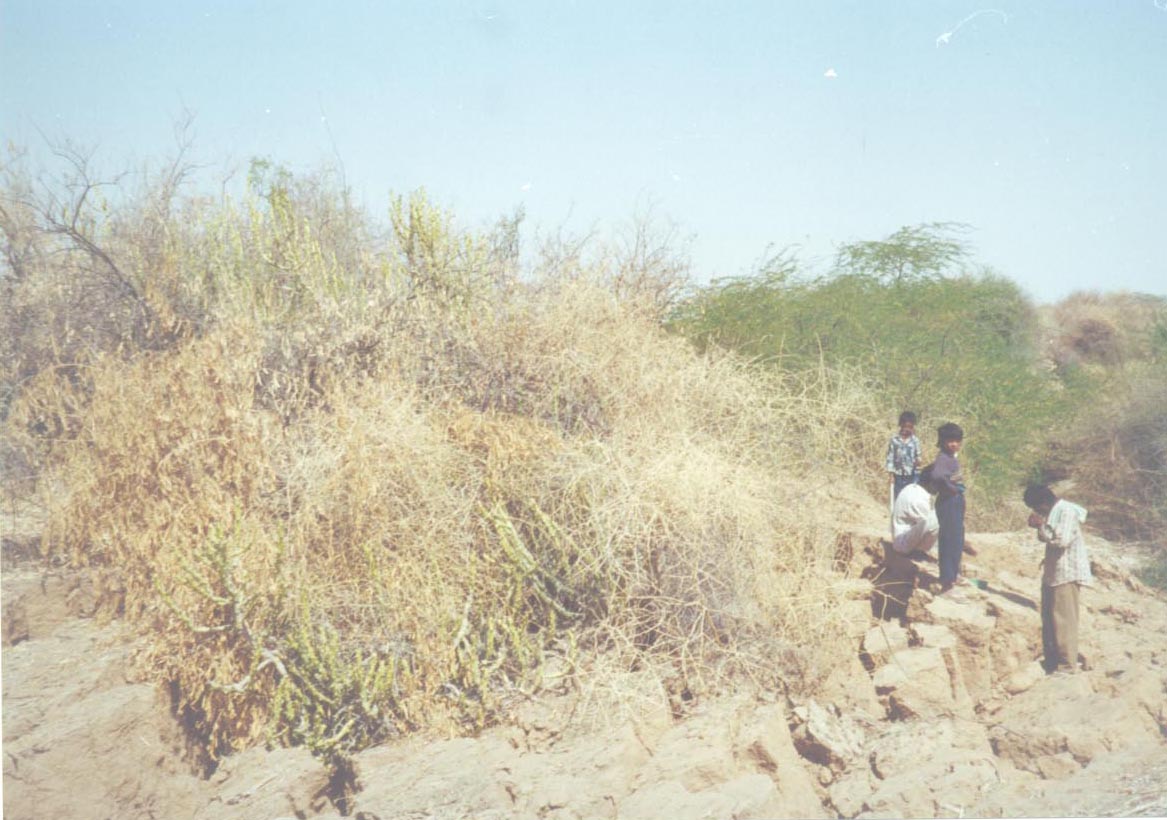
Figure 20
Picture of the dried out shrubs and trees due to the intense
shaking
generated during the earthquake.
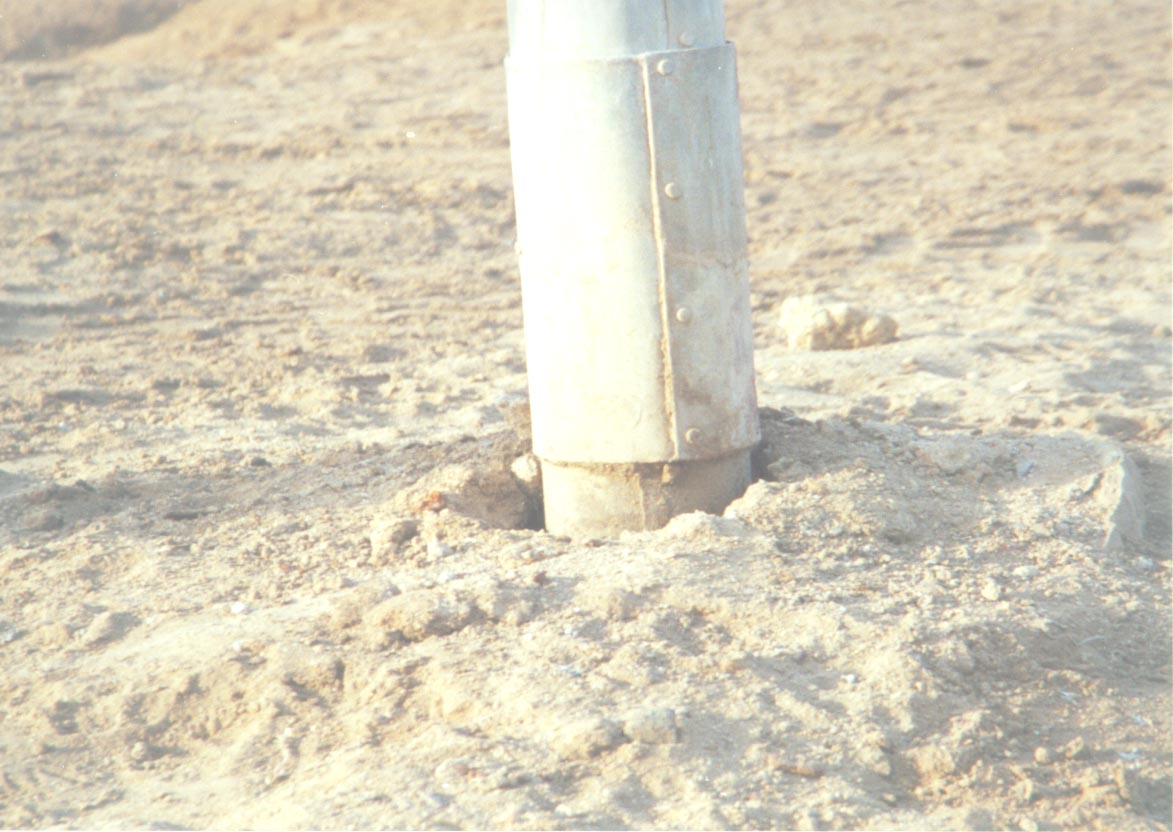
Figure 21
A dislodgment of telephone pole due to vertical uplift.
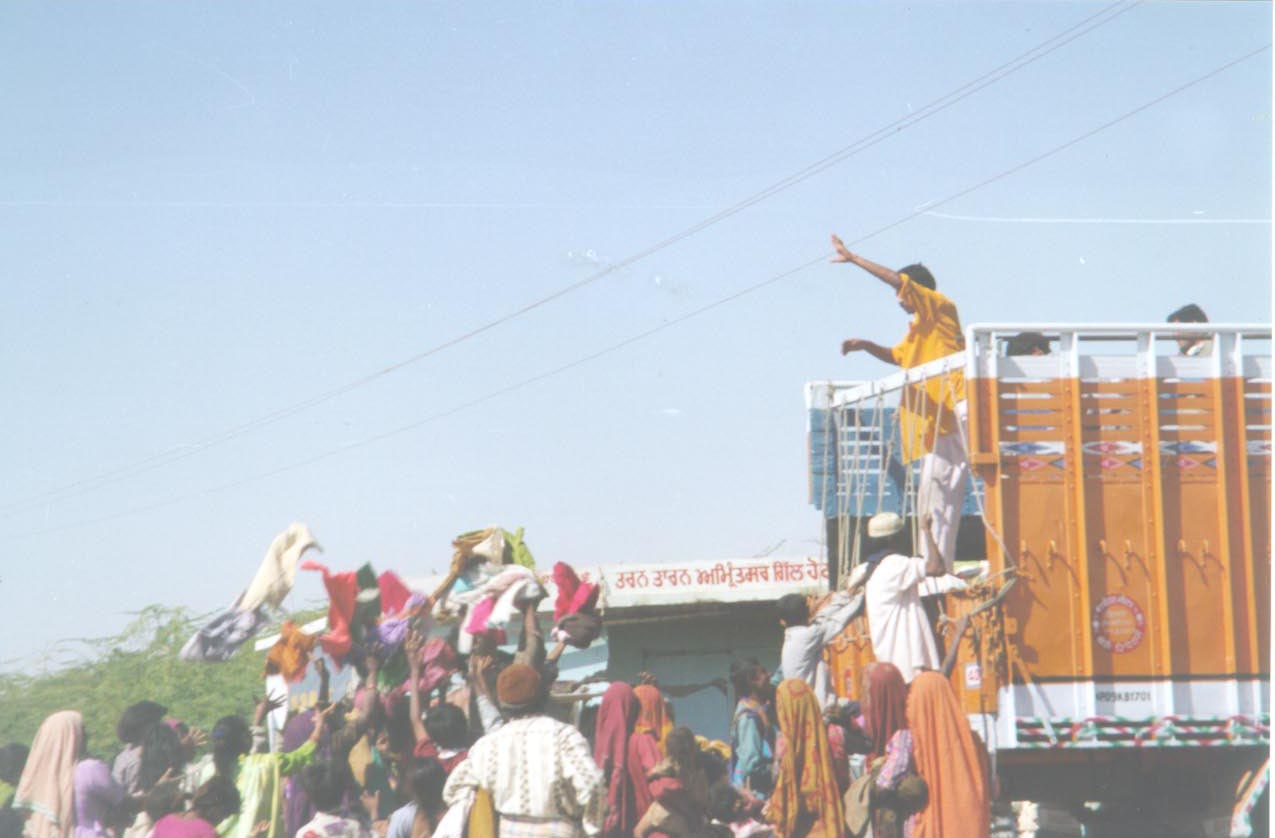
Figure 22
Distribution of clothes during earthquake relief work to the
earthquake
affected people in Nanichirai village (23° 11´ N, 70°
13´
E).
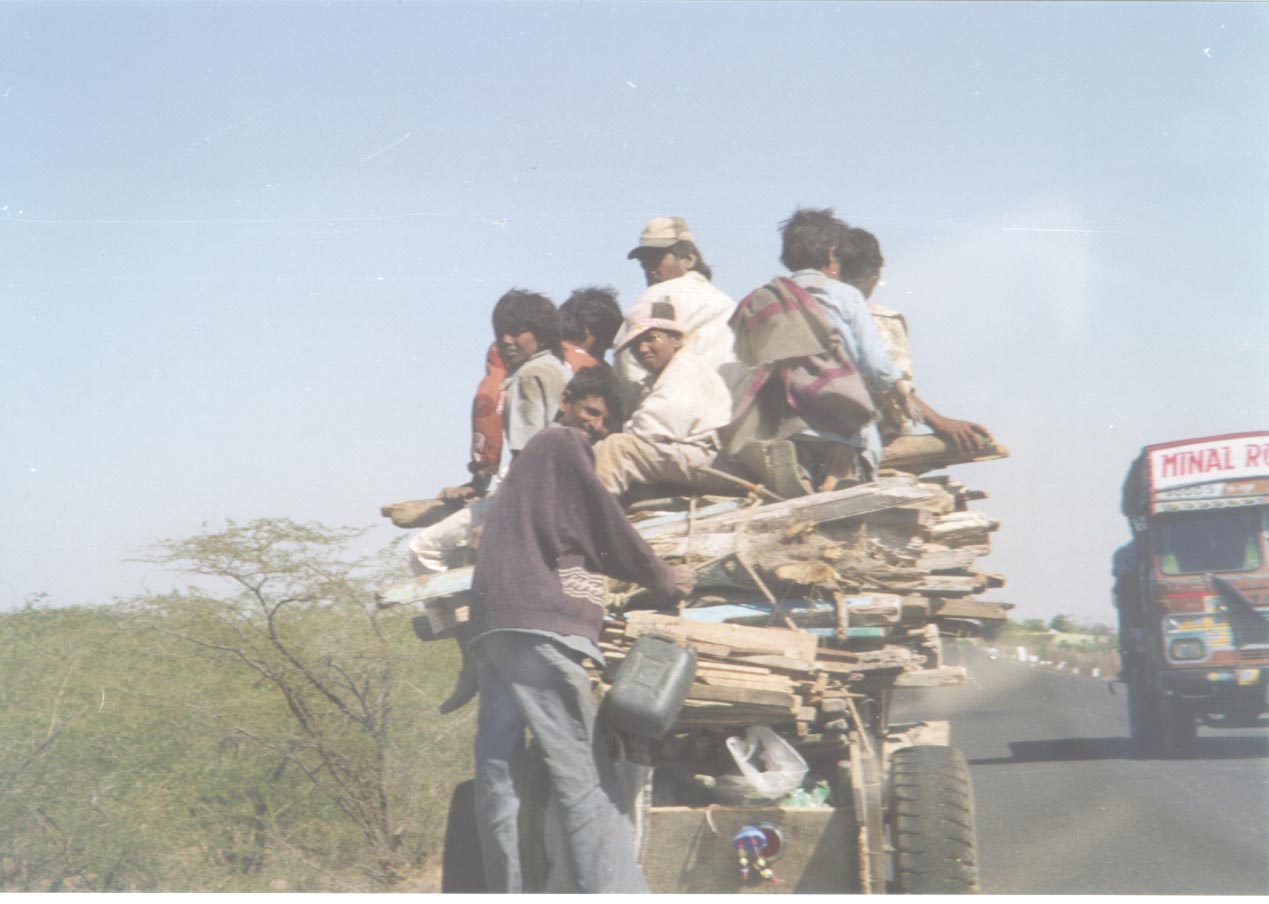
Figure 23
People are taking the remains of the houses after the earthquake
near Anjar village (23° 06´ N, 70° 02´ E).
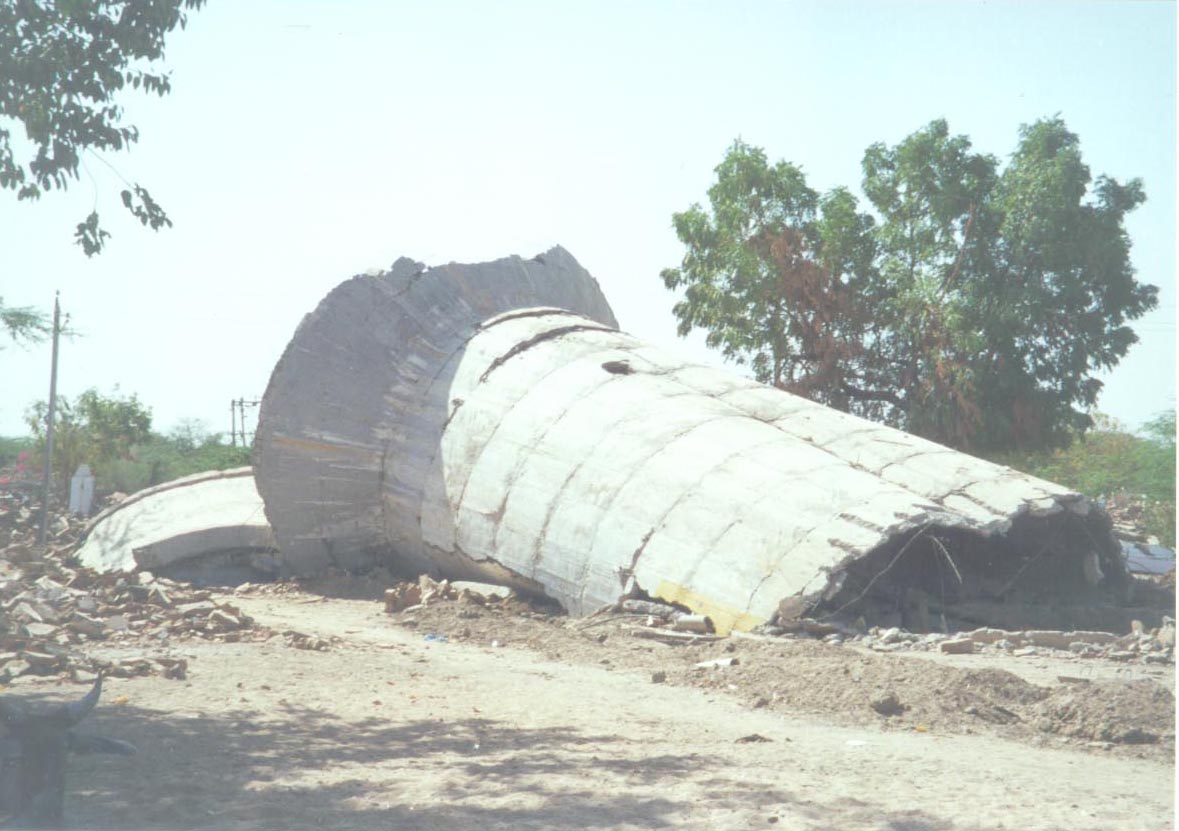
Figure 24
A damaged water storage tank
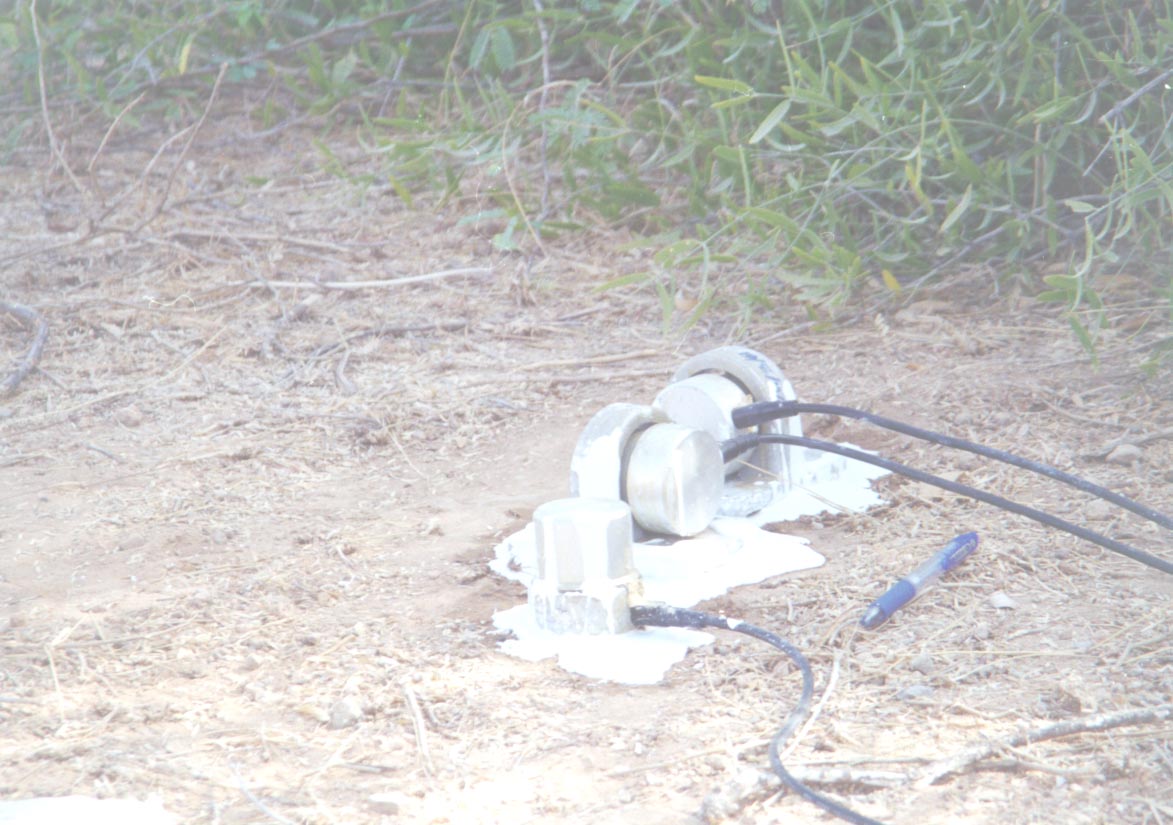
Figure 25
Geophones installed to measure the seismic waves generated due to
earthquake activity.
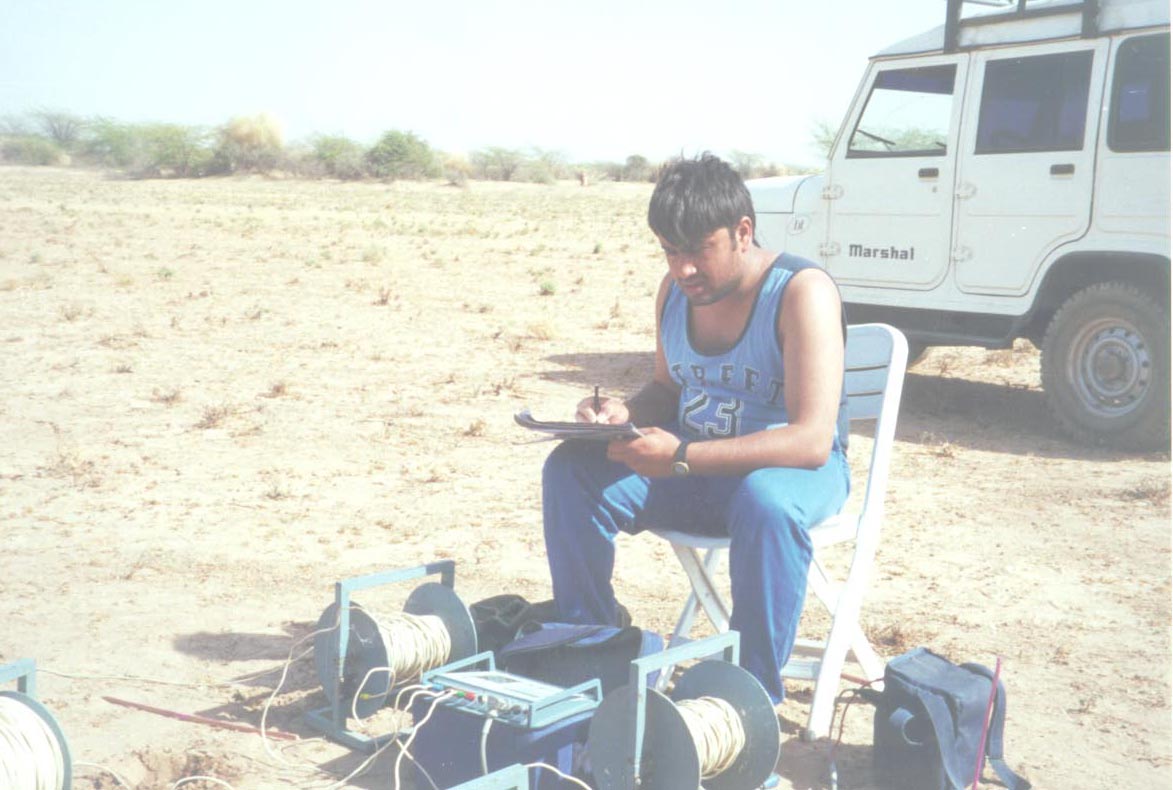
Figure 26
A resistivity survey being undertaken near Budharmora (23°
20´
N, 70° 11´ E).
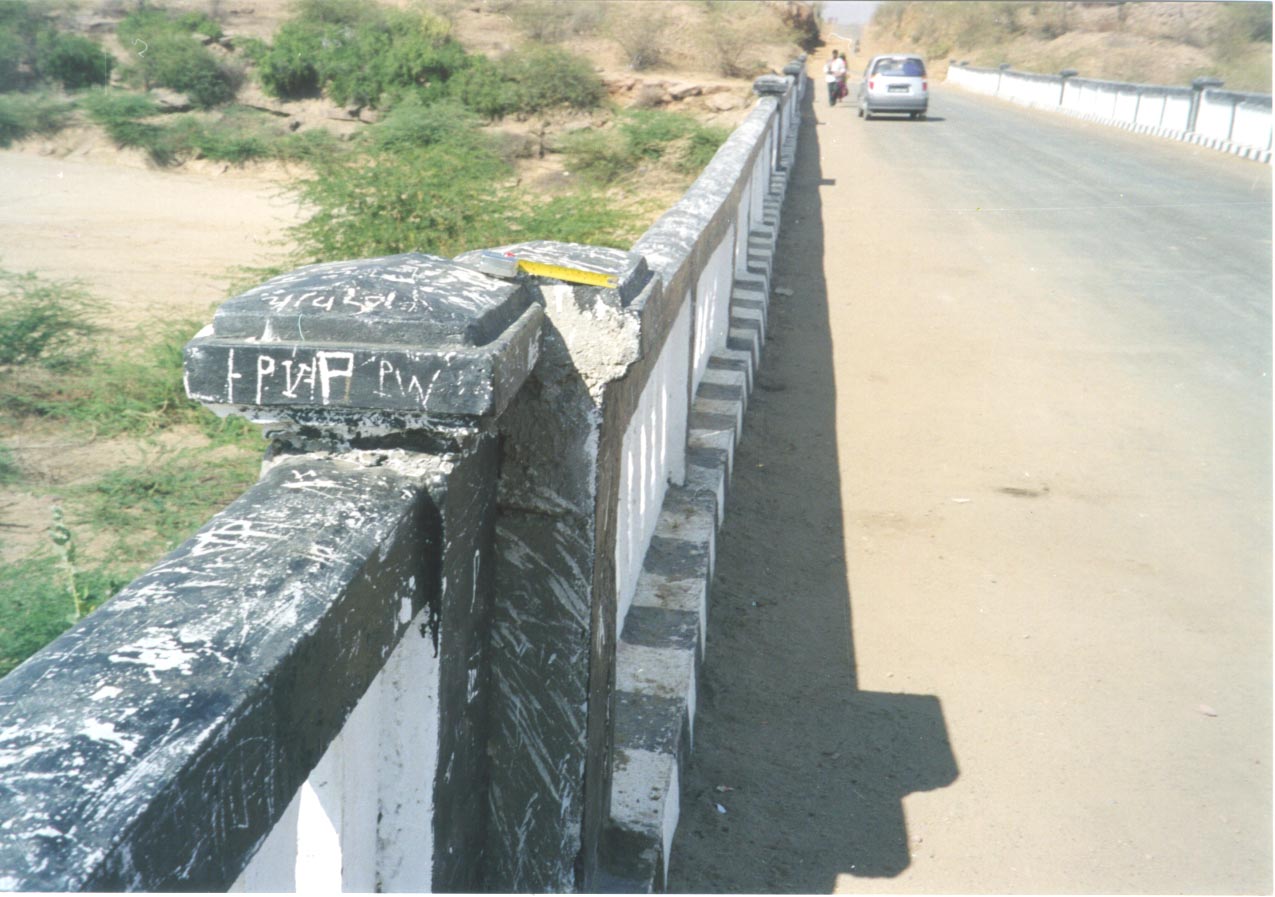
Figure 27
Bridge on Rapar – Bachau road (23° 35´ N, 70°
33´
E). The strike of the bridge is N 20° – N 200°. Dextral type
displacement
(~ 6 inch displacement) of the bridge towards N 20°.
Figure 28
Bridge on Bachau – Bhuj road (23° 19´ N, 70°
09´
E). Strike of the bridge
is N 105° – N 285° and displacement is towards N 265°.
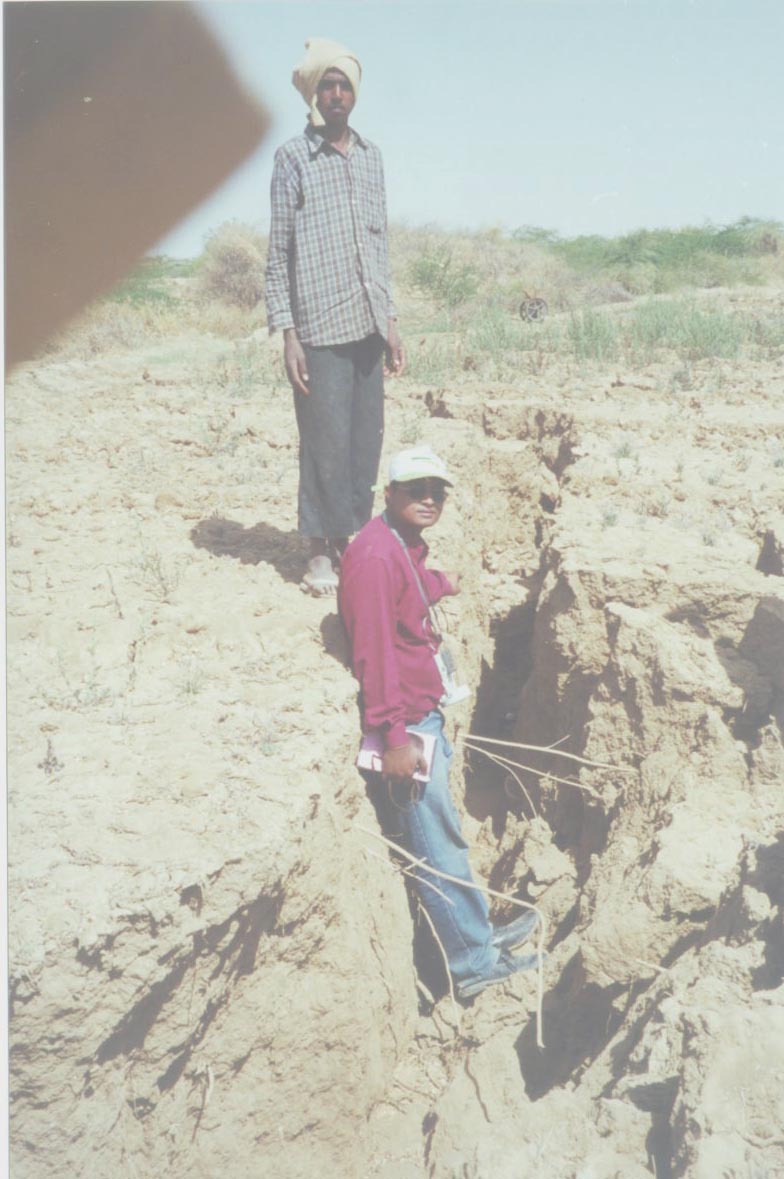
Figure 29
Cracks, several meters in depth developed near Kankoi village
(23°
33´ N, 70° 22´ E).
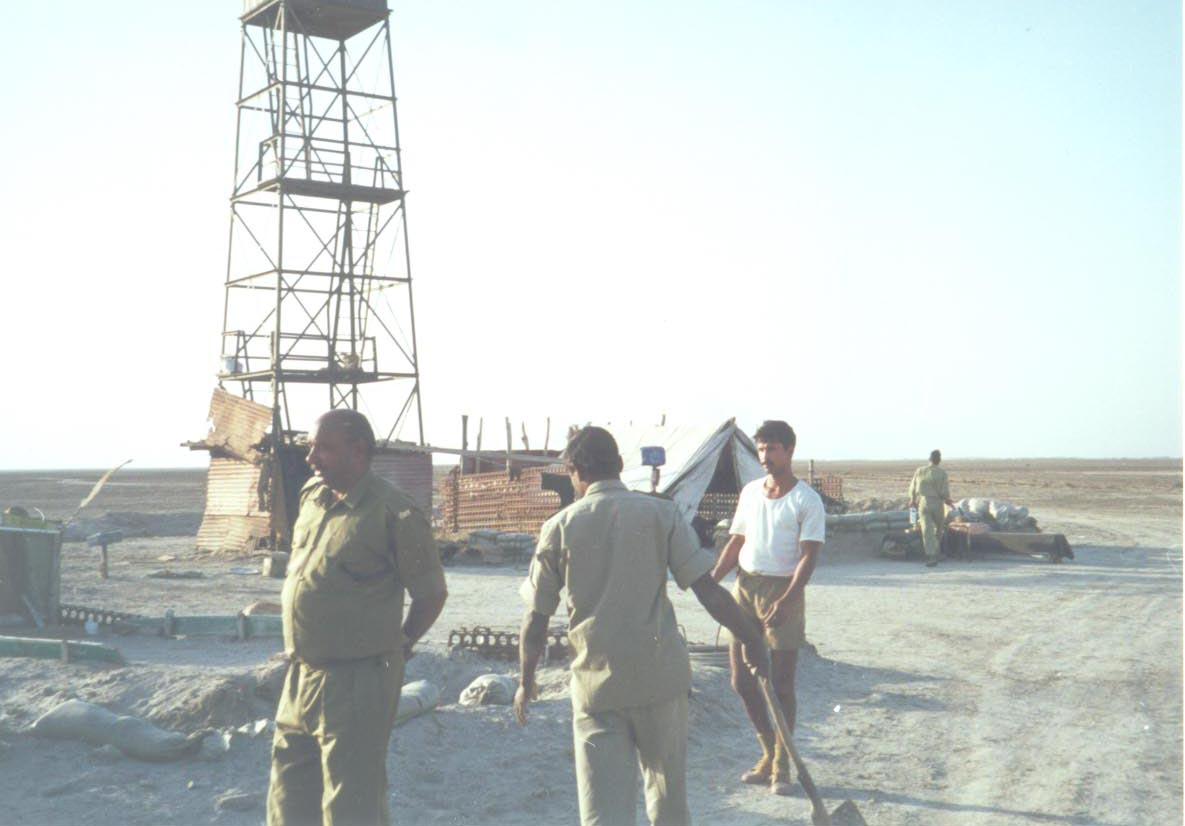
Figure 30
A Border Security Force camp on the way to Allabund Fault.
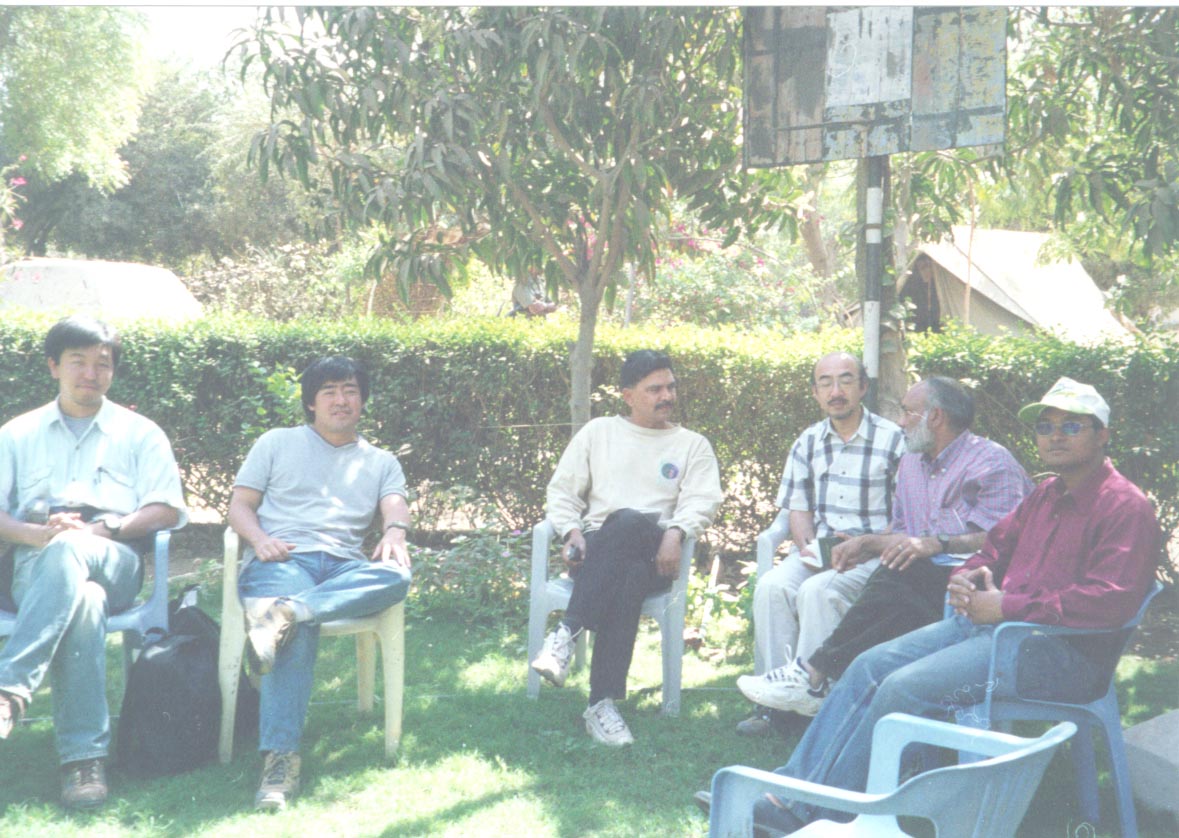
Figure 31
Bhuj DIG and IIT K and Japanese team
Figure 32
Contact between two different lithology, 5 kilometers from
Kharoi, along Kharoi -Rapar road. Along this contact rupture upto
5 Km was seen.
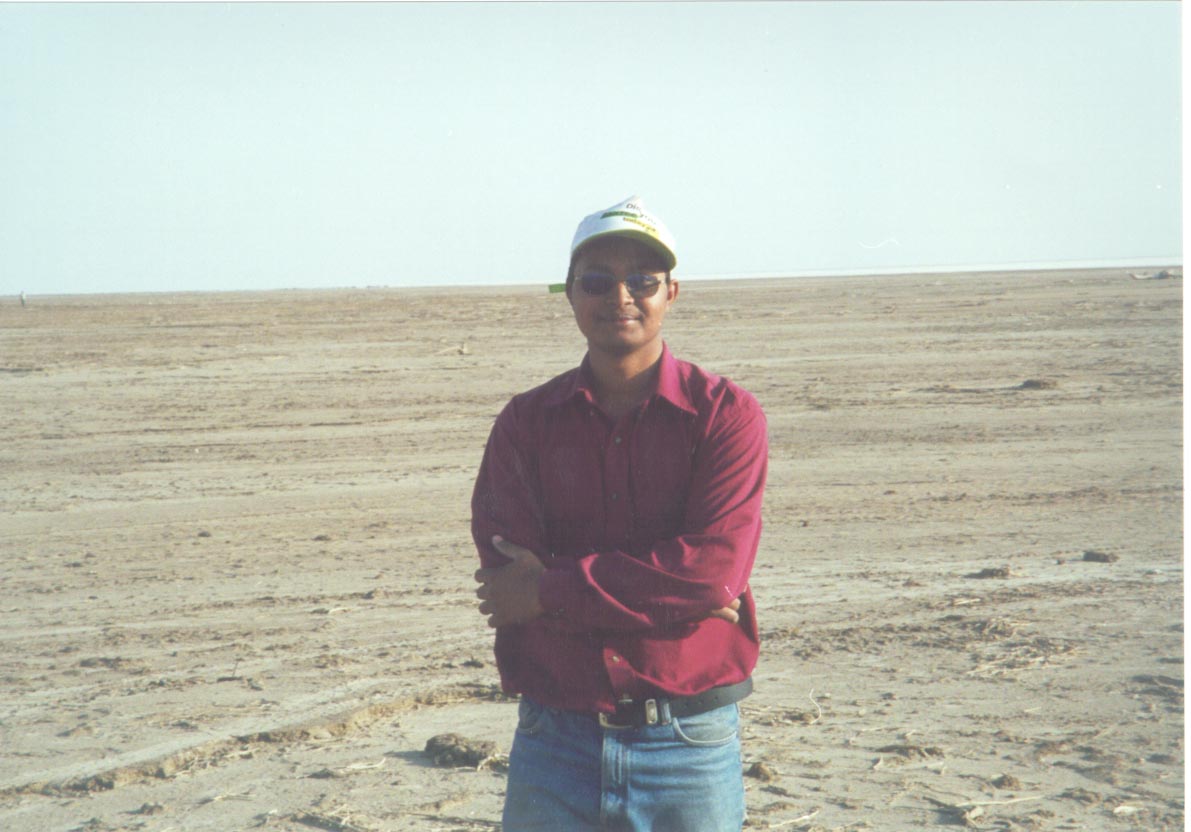
Figure 33
Sanjeeb Bhoi over Alah Bund Fault created during 1916 earthquake.
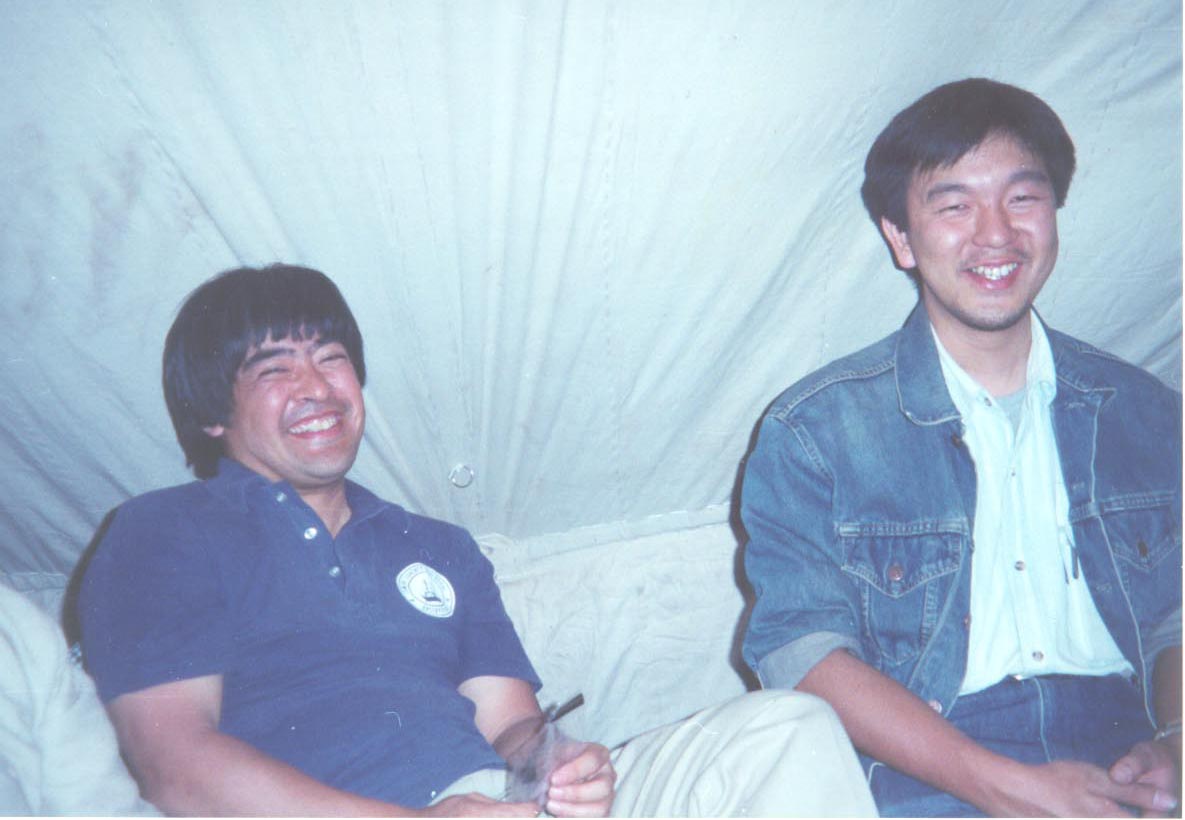
Figure 34
Jim Mori and Nagashi in relax mood in the camp.